25. Oslo, Norway
> Overall score (0-100): 28.6
> Potential sea-level rise impact 2050 (0-100): 1.1 (43rd largest impact)
> Avg. annual temperature, 1970-2000: 43.9°F
> Avg. annual temperature, 2050: 48.0°F (32nd largest increase)
> Population, 2018: 1,012,000

24. New York, US
> Overall score (0-100): 29.0
> Potential sea-level rise impact 2050 (0-100): 16.1 (14th largest impact)
> Avg. annual temperature, 1970-2000: 53.6°F
> Avg. annual temperature, 2050: 58.9°F (15th largest increase)
> Population, 2018: 18,819,000

23. Philadelphia, US
> Overall score (0-100): 32.9
> Potential sea-level rise impact 2050 (0-100): 18.3 (12th largest impact)
> Avg. annual temperature, 1970-2000: 53.9°F
> Avg. annual temperature, 2050: 59.7°F (5th largest increase)
> Population, 2018: 5,695,000

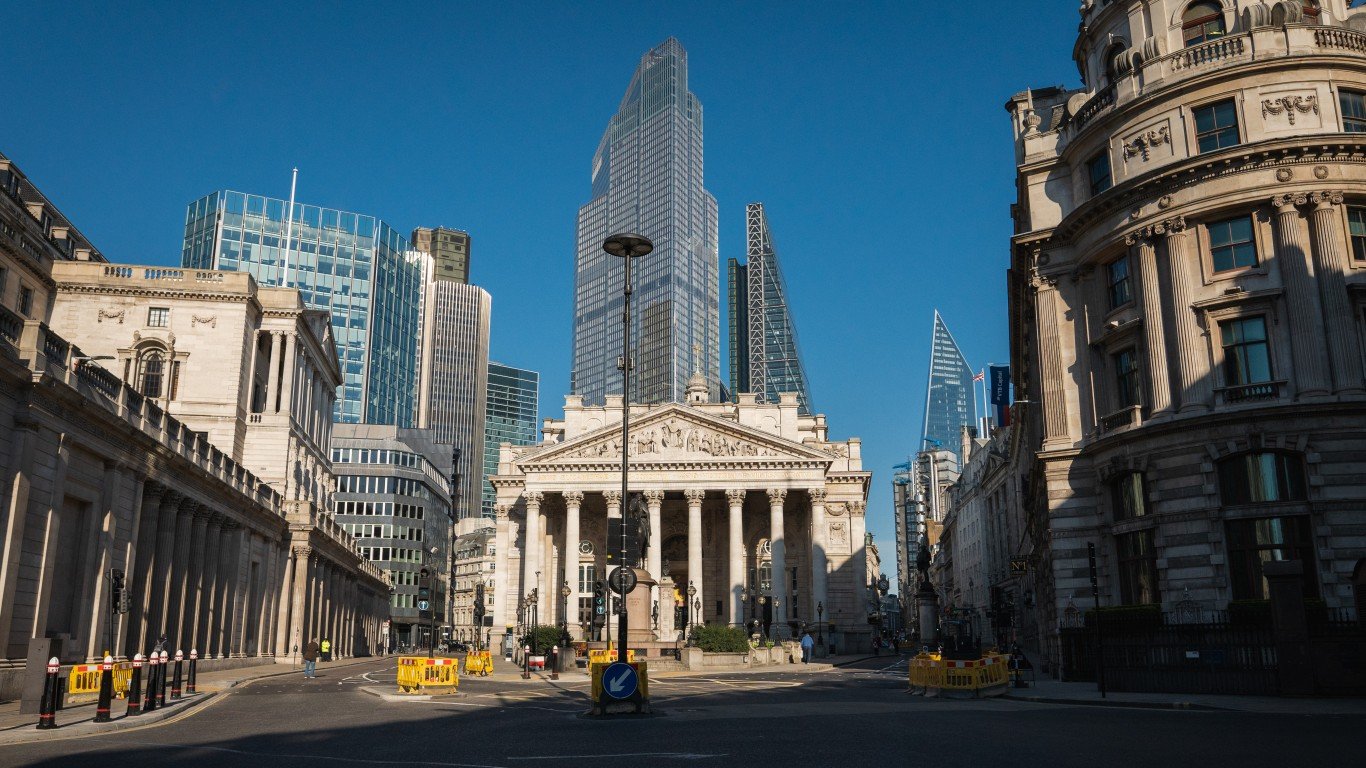
22. London, UK
> Overall score (0-100): 33.6
> Potential sea-level rise impact 2050 (0-100): 28.5 (7th largest impact)
> Avg. annual temperature, 1970-2000: 52.0°F
> Avg. annual temperature, 2050: 55.8°F (41st largest increase)
> Population, 2018: 9,046,000

21. St. Petersburg, Russia
> Overall score (0-100): 33.7
> Potential sea-level rise impact 2050 (0-100): 1.2 (41st largest impact)
> Avg. annual temperature, 1970-2000: 41.7°F
> Avg. annual temperature, 2050: 46.8°F (17th largest increase)
> Population, 2018: 5,383,000

 24/7 Tempo


