
5. Melbourne, Australia
> Overall score (0-100): 49.5
> Potential sea-level rise impact 2050 (0-100): 2.2 (34th largest impact)
> Avg. annual temperature, 1970-2000: 59.6°F
> Avg. annual temperature, 2050: 62.1°F (70th largest increase)
> Population, 2018: 4,771,000


4. Shenzhen, China
> Overall score (0-100): 62.2
> Potential sea-level rise impact 2050 (0-100): 28.1 (8th largest impact)
> Avg. annual temperature, 1970-2000: 73.1°F
> Avg. annual temperature, 2050: 76.5°F (50th largest increase)
> Population, 2018: 11,908,000

3. Amsterdam, Netherlands
> Overall score (0-100): 84.3
> Potential sea-level rise impact 2050 (0-100): 89.6 (2nd largest impact)
> Avg. annual temperature, 1970-2000: 50.1°F
> Avg. annual temperature, 2050: 52.3°F (76th largest increase)
> Population, 2018: 1,132,000
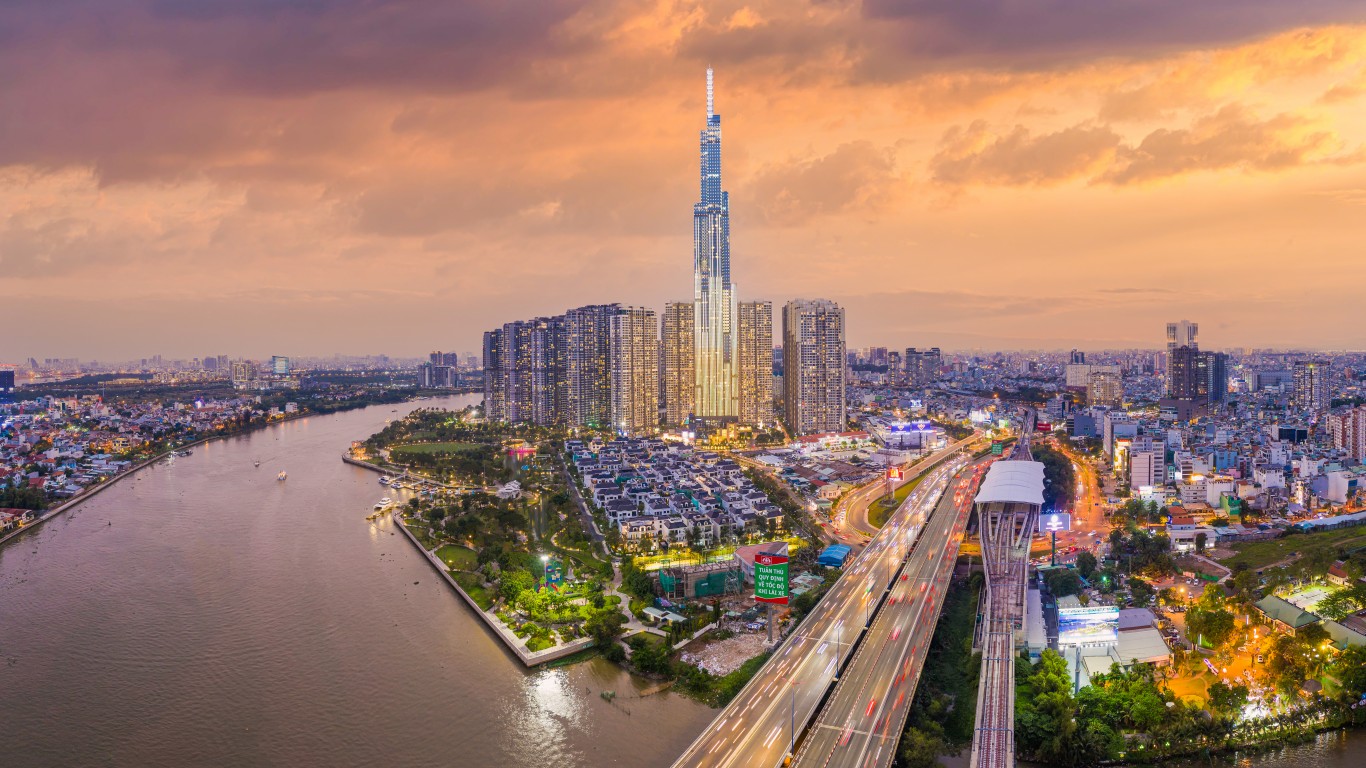
2. Ho Chi Minh City, Vietnam
> Overall score (0-100): 85.3
> Potential sea-level rise impact 2050 (0-100): 88.7 (3rd largest impact)
> Avg. annual temperature, 1970-2000: 81.5°F
> Avg. annual temperature, 2050: 84.5°F (58th largest increase)
> Population, 2018: 8,145,000
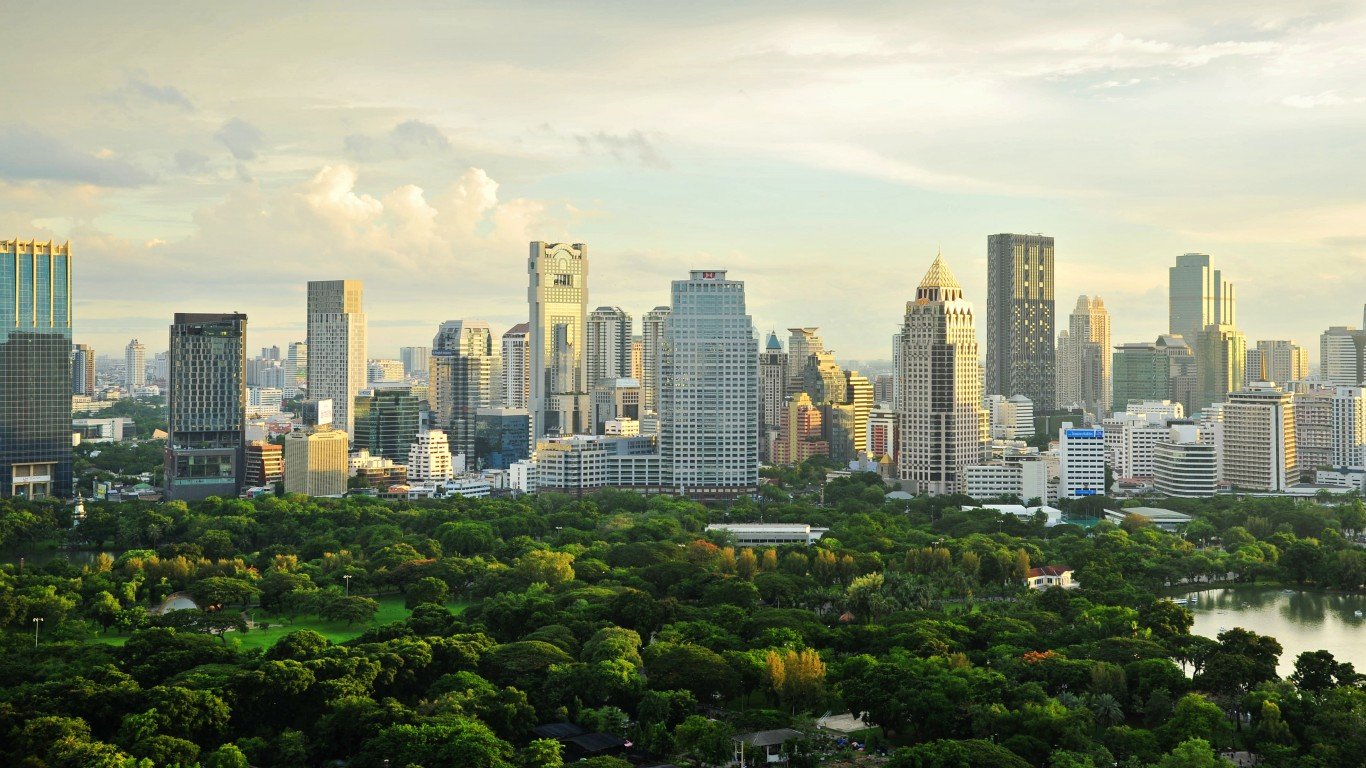
1. Bangkok, Thailand
> Overall score (0-100): 100.0
> Potential sea-level rise impact 2050 (0-100): 100.0 (the largest impact)
> Avg. annual temperature, 1970-2000: 83.1°F
> Avg. annual temperature, 2050: 86.1°F (58th largest increase)
> Population, 2018: 10,156,000


