
10. Marrakesh, Morocco
> Overall score (0-100): 44.6
> Potential sea-level rise impact 2050 (0-100): 1.0 (44th largest impact)
> Avg. annual temperature, 1970-2000: 66.8°F
> Avg. annual temperature, 2050: 72.0°F (16th largest increase)
> Population, 2018: 976,000

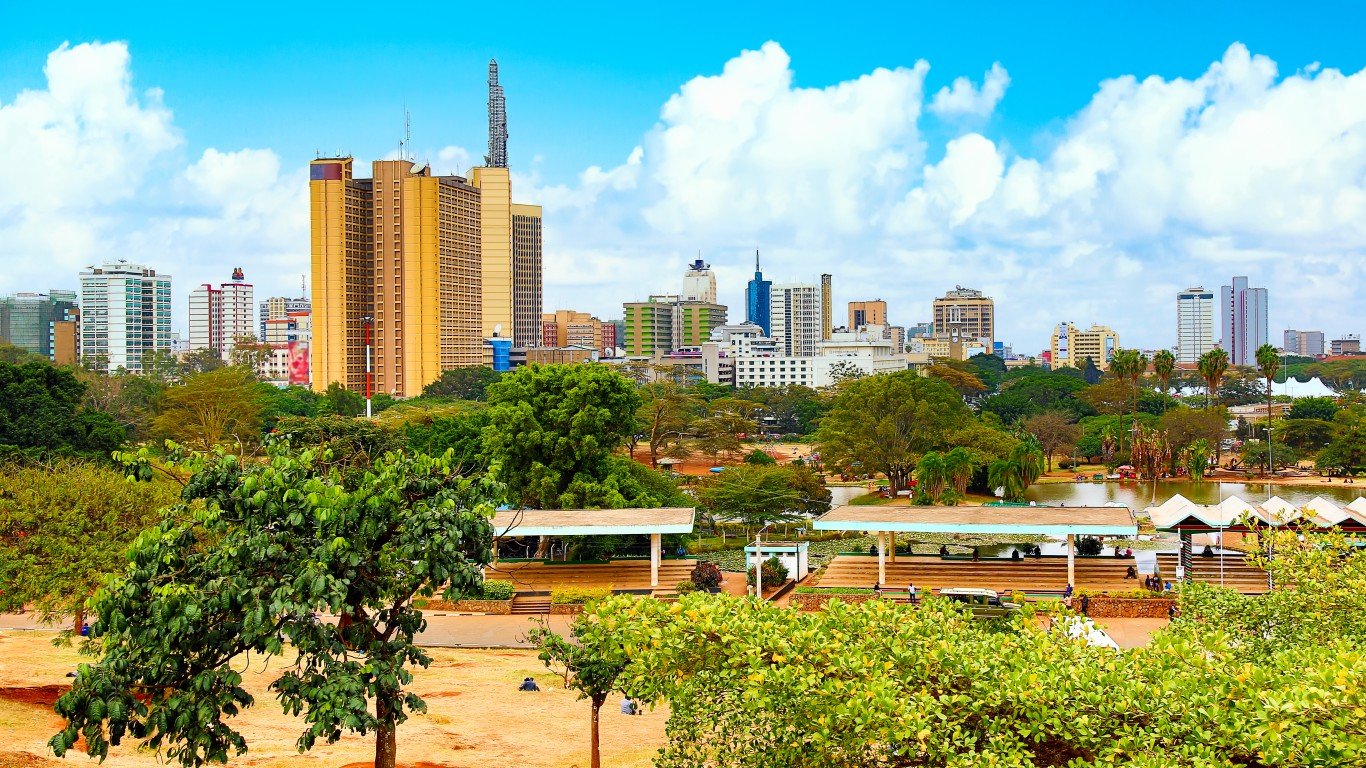
9. Nairobi, Kenya
> Overall score (0-100): 44.8
> Potential sea-level rise impact 2050 (0-100): 1.0 (44th largest impact)
> Avg. annual temperature, 1970-2000: 65.5°F
> Avg. annual temperature, 2050: 69.7°F (30th largest increase)
> Population, 2018: 4,386,000
 24/7 Tempo
8. Boston, US
> Overall score (0-100): 44.8
> Potential sea-level rise impact 2050 (0-100): 8.2 (21st largest impact)
> Avg. annual temperature, 1970-2000: 50.5°F
> Avg. annual temperature, 2050: 55.2°F (19th largest increase)
> Population, 2018: 4,308,000
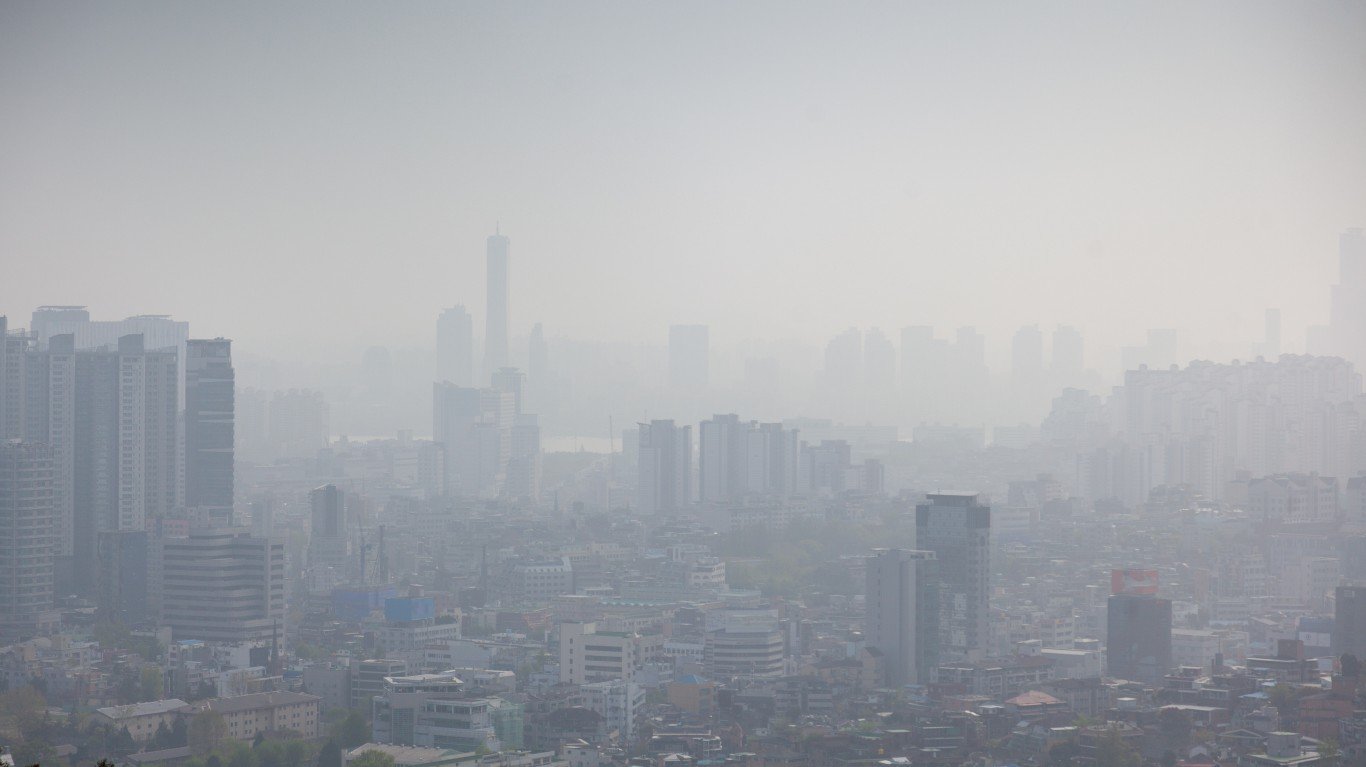
7. Seoul, South Korea
> Overall score (0-100): 45.8
> Potential sea-level rise impact 2050 (0-100): 6.3 (22nd largest impact)
> Avg. annual temperature, 1970-2000: 54.0°F
> Avg. annual temperature, 2050: 57.8°F (38th largest increase)
> Population, 2018: 9,963,000
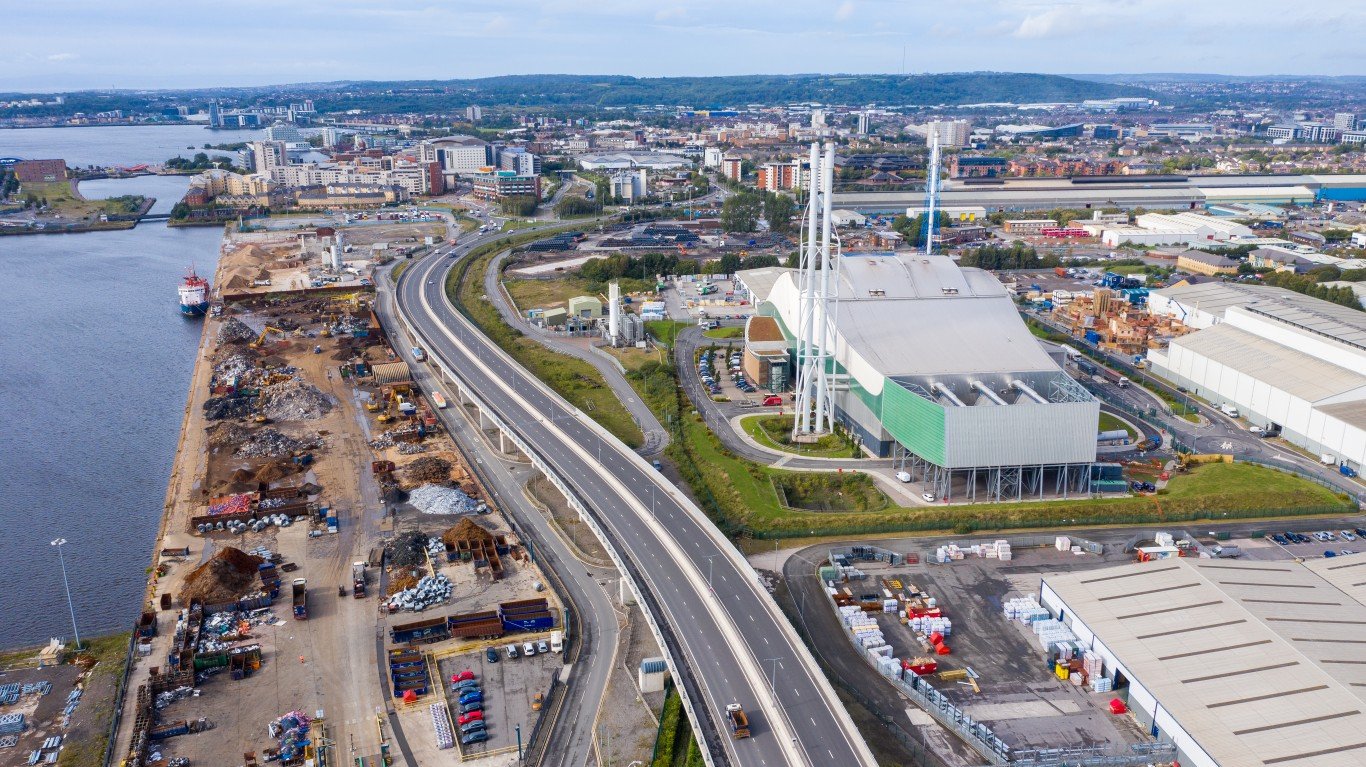
6. Cardiff, UK
> Overall score (0-100): 47.0
> Potential sea-level rise impact 2050 (0-100): 45.9 (4th largest impact)
> Avg. annual temperature, 1970-2000: 50.9°F
> Avg. annual temperature, 2050: 54.0°F (57th largest increase)
> Population, 2018: 471,000


