5. Tulsa, Oklahoma
> Total score: 45.91
> Health guideline violations score (0-20): 6.88 – 31st worst out of 70 cities
> Most prevalent contaminant compared to other cities: Bromodichloromethane – 7th worst out of 70 cities

4. Wilmington, Delaware
> Total score: 52.60
> Health guideline violations score (0-20): 20.00 – Worst out of 70 cities
> Most prevalent contaminant compared to other cities: Bromodichloromethane and total THMs – Worst out of 70 cities

3. Pittsburgh, Pennsylvania
> Total score: 53.35
> Health guideline violations score (0-20): 7.50 – 23rd worst out of 70 cities
> Most prevalent contaminant compared to other cities: Bromodichloromethane – 3rd worst out of 70 cities
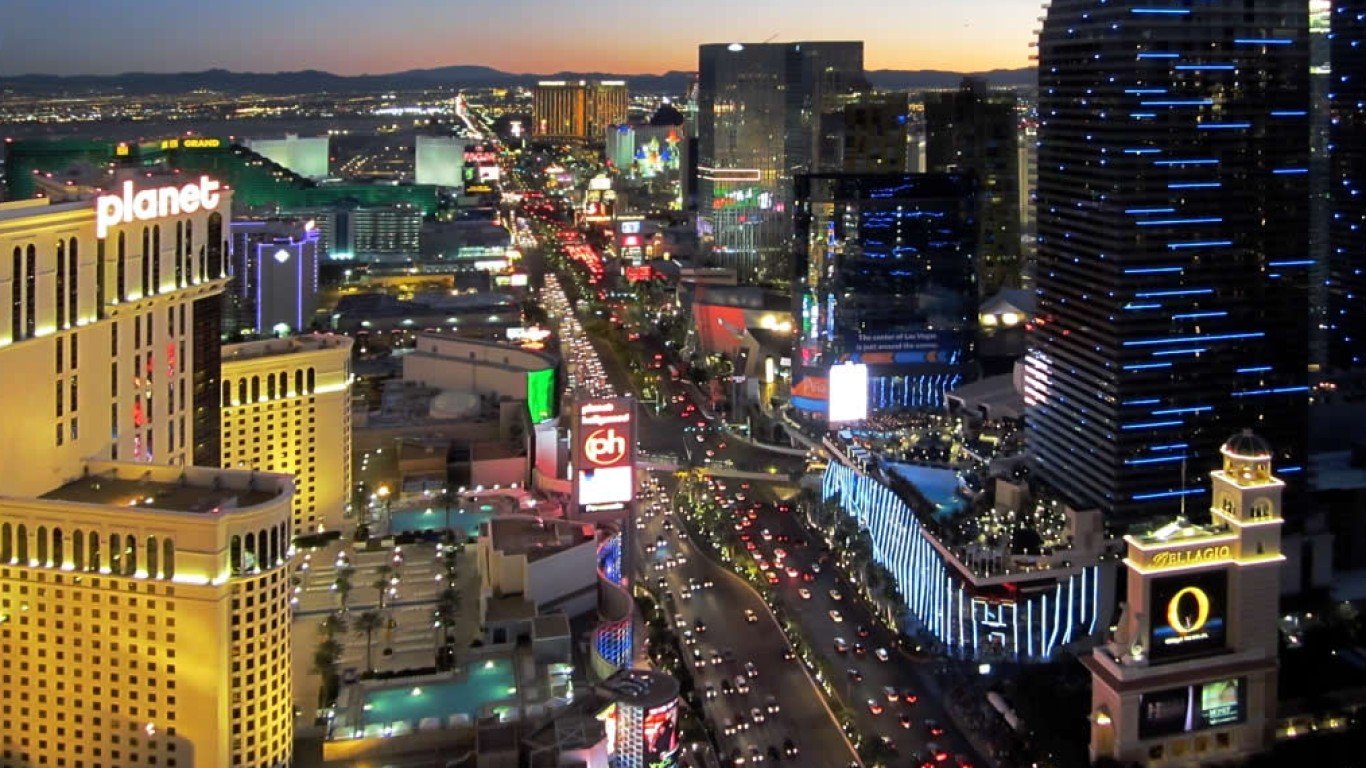
2. Las Vegas, Nevada
> Total score: 55.33
> Health guideline violations score (0-20): 9.38 – 6th worst out of 70 cities
> Most prevalent contaminant compared to other cities: Bromodichloromethane – 2nd worst out of 70 cities

1. Newark, New Jersey
> Total score: 57.17
> Health guideline violations score (0-20): 6.88 – 31st worst out of 70 cities
> Most prevalent contaminant compared to other cities: Total haloacetic acids and Chloroform – Worst out of 70 cities


