30. Indiana
> Population: 6,805,985 (+0.3% in last year)
> Life expectancy at birth: 76.5 years (10th lowest)
> Median household income: $62,743 (14th lowest)
> Median home value: $182,400 (9th lowest)
> Median housing costs as pct. of income: 15.2% (6th lowest)
> August 2022 unemployment: 3.1% (18th lowest)
Though less favorable as a place to live than most states, Indiana ranks near the middle of the 50 states for quality of life. State residents benefit from a low cost of living, with goods and services costing about 7.5% less than average. Housing is particularly affordable, with median housing costs – considering both renters and homeowners – accounting for just 15.2% of the income the typical household earns, compared to the 17.4% national ratio.
In some key environmental measures, however, Indiana lags behind much of the country, with worse air quality and less sunlight than most states. Indiana also invests far less in its school system than average. Spending at Indiana public schools totals just $10,137 per pupil annually, the 12th lowest amount of any state.
29. California
> Population: 39,237,836 (-0.8% in last year)
> Life expectancy at birth: 81.0 years (2nd highest)
> Median household income: $84,907 (5th highest)
> Median home value: $648,100 (2nd highest)
> Median housing costs as pct. of income: 21.0% (the highest)
> August 2022 unemployment: 4.1% (14th highest)
California has the least affordable housing market of any state in the country. Median housing costs – considering both renters and homeowners – account for 21.0% of the income the typical household earns, compared to the 17.4% average housing cost-to-income ratio nationwide. The lack of affordable housing may be pushing many out of the state. Considering only net migration and excluding natural growth – births minus deaths – the state’s population declined by 1.1% from 2020 to 2021, the third largest such decline of any state, trailing only New York and Illinois. California also has higher unemployment and higher crime rates than most other states.
Still, California residents benefit from well-funded public amenities and services. For example, nearly 93% of the state’s population live in close proximity to a place for physical exercise, such as a park or recreation center, the largest share of any state and well above the 79.8% national share. Additionally, California spends an average of $13,679 annually per pupil on its public school system, more than most other states.
28. Kansas
> Population: 2,934,582 (-0.1% in last year)
> Life expectancy at birth: 77.8 years (17th lowest)
> Median household income: $64,124 (18th lowest)
> Median home value: $183,800 (10th lowest)
> Median housing costs as pct. of income: 16.3% (18th lowest)
> August 2022 unemployment: 3.1% (18th lowest)
Kansas ranks close to the middle of all states for overall quality of life. While incomes are slightly lower than average in Kansas — the state’s median household income of $64,124 a year is about $5,600 below the national median — the cost of living in the state is relatively low. Goods and services in Kansas are about 7.6% less expensive than they are nationwide on average.
Other key socioeconomic measures are also mixed in Kansas. For one, the state’s job market is relatively strong with an August 2022 unemployment rate of only 3.1%, well below the 3.8% national jobless rate. However, both property and violent crime rates in the state are slightly higher than the national average.

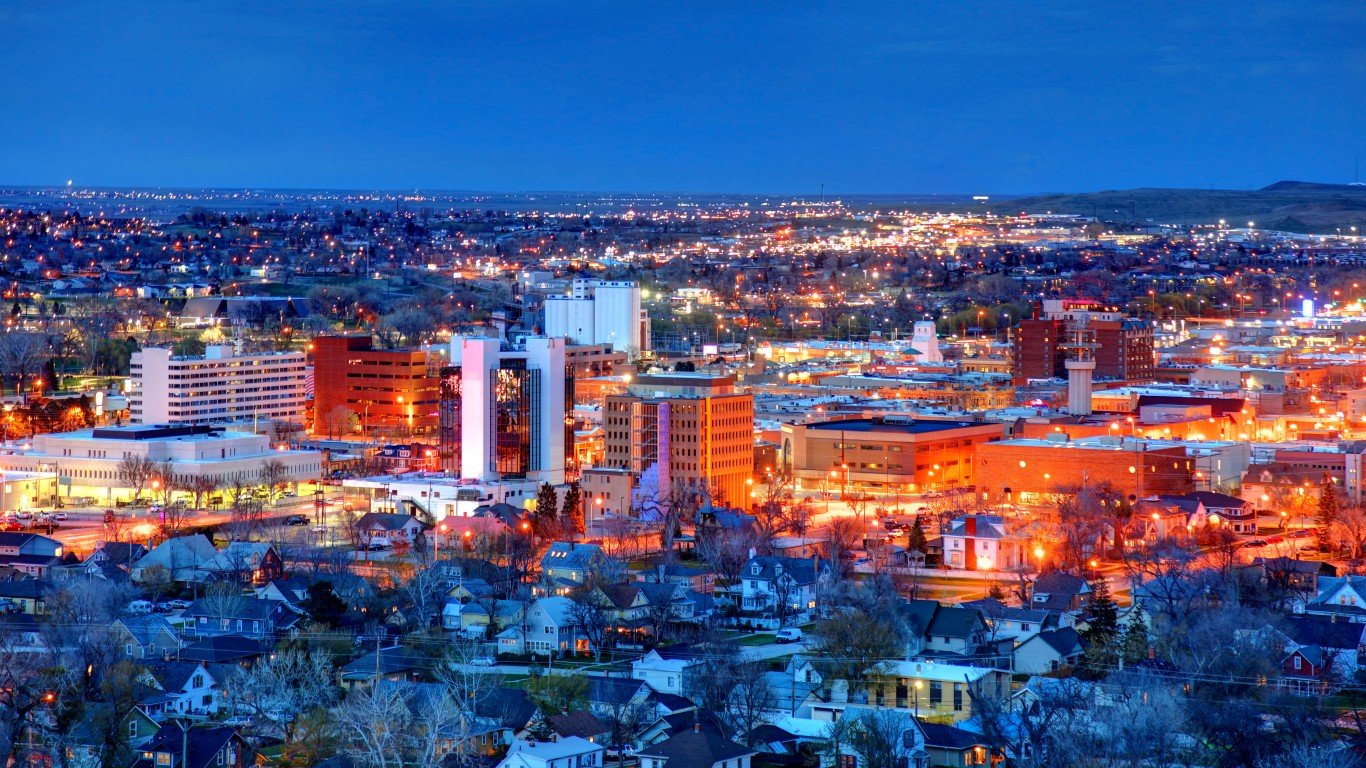
27. South Dakota
> Population: 895,376 (+1.0% in last year)
> Life expectancy at birth: 78.2 years (22nd lowest)
> Median household income: $66,143 (22nd lowest)
> Median home value: $219,900 (17th lowest)
> Median housing costs as pct. of income: 16.4% (20th lowest)
> August 2022 unemployment: 2.4% (7th lowest)
South Dakota is one of the more affordable states to live in. Goods and services in the state are about 8.5% less expensive on average than they are nationwide. Housing is particularly affordable in relation to income. Median housing costs – considering both renters and homeowners – account for just 16.4% of the income the typical household earns, compared to the 17.4% average housing cost-to-income ratio nationwide.
Still, there are also some glaring drawbacks to overall quality of life in South Dakota. The state’s violent crime rate of 501 incidents per 100,000 people is the eighth highest in the country. Additionally, only 66% of the state’s population live in close proximity to places for physical exercise, such as parks, compared to 79.8% of Americans nationwide.

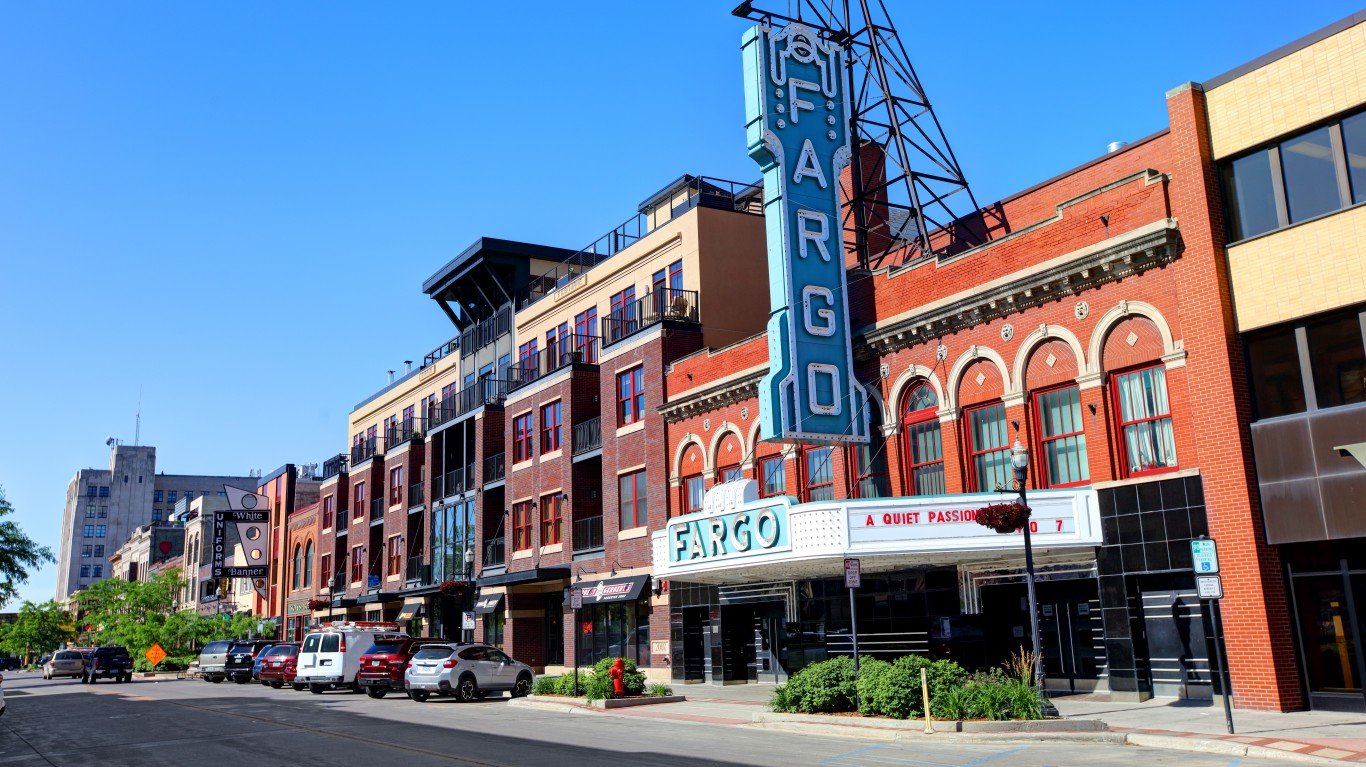
26. North Dakota
> Population: 774,948 (-0.5% in last year)
> Life expectancy at birth: 78.8 years (21st highest)
> Median household income: $66,519 (25th lowest)
> Median home value: $224,400 (19th lowest)
> Median housing costs as pct. of income: 15.0% (4th lowest)
> August 2022 unemployment: 2.2% (5th lowest)
Like its neighbor South Dakota, North Dakota ranks close to the middle of all states for overall quality of life. State residents benefit from a strong job market with an August 2022 jobless rate of just 2.2%, one of the lowest in the country and well below the 3.8% national rate. And while the state’s median household income of $66,519 is about $3,000 below the national median, poverty is less common in the state than it is nationwide. The state’s poverty rate of 11.1% is lower than in most other states and below the 12.8% national poverty rate.
North Dakota is not without some disadvantages, however. For one, the state gets less sunlight than most parts of the country. Additionally, only 64.4% of the state’s population live in close proximity to places for physical exercise, such as parks or recreation centers, compared to 79.8% of all Americans nationwide.


