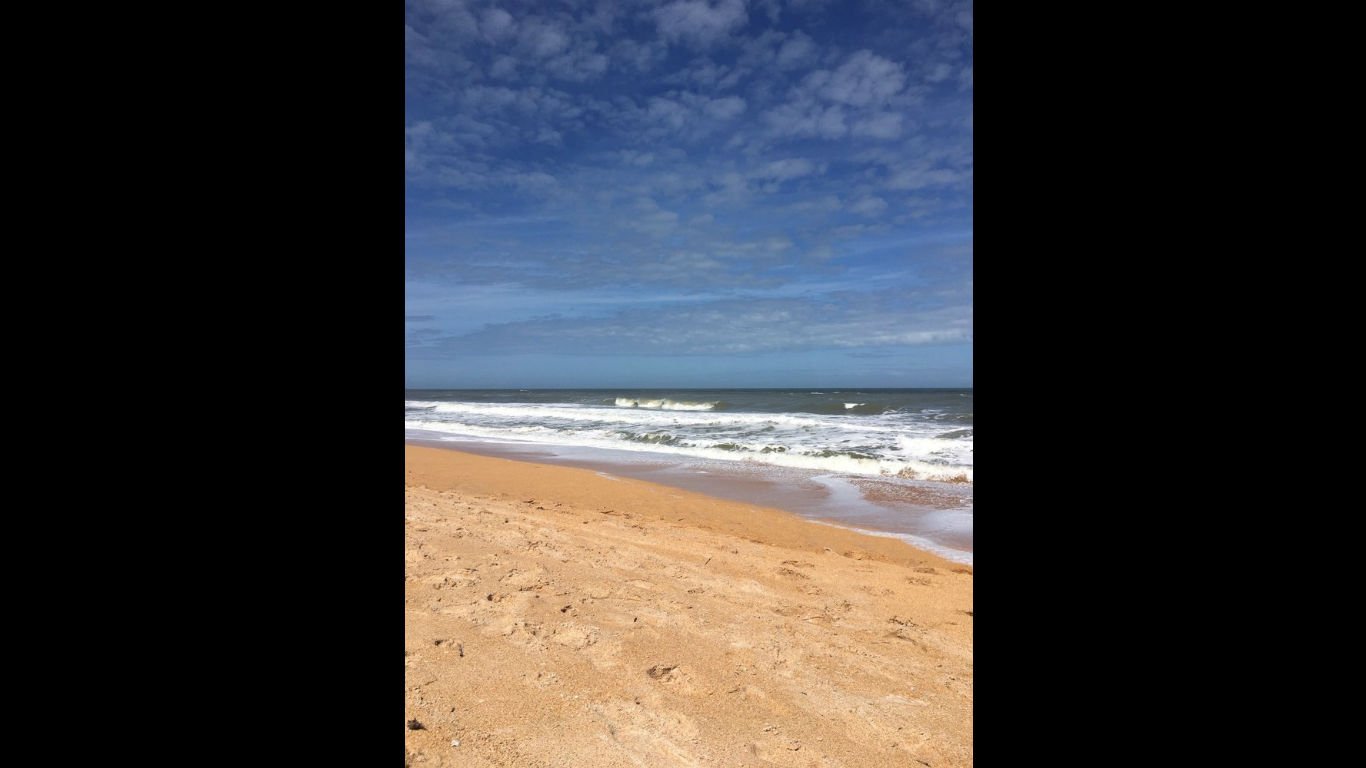
5. Varn Park, Flagler County, FL
> Avg. annual beach loss: -17.2%
> Beach length 2008: 14.2 miles
> Beach length 2018: 2.1 miles (-84.9%)
> Area population change (2013-2017): 97,301 to 105,015 (+7.9%)
> Avg. monthly precipitation: 4.22 inches


4. San Diego Bay, San Diego County, CA
> Avg. annual beach loss: -22.5%
> Beach length 2007: 49.1 miles
> Beach length 2018: 3.0 miles (-94.0%)
> Area population change (2013-2017): 3,138,265 to 3,283,665 (+4.6%)
> Avg. monthly precipitation: 1.21 inches
3. Ocean-Side Beach, North Of Cape Point A, Carteret County, NC
> Avg. annual beach loss: -23.0%
> Beach length 2007: 56.7 miles
> Beach length 2018: 3.2 miles (-94.3%)
> Area population change (2013-2017): 67,198 to 68,699 (+2.2%)
> Avg. monthly precipitation: 4.53 inches

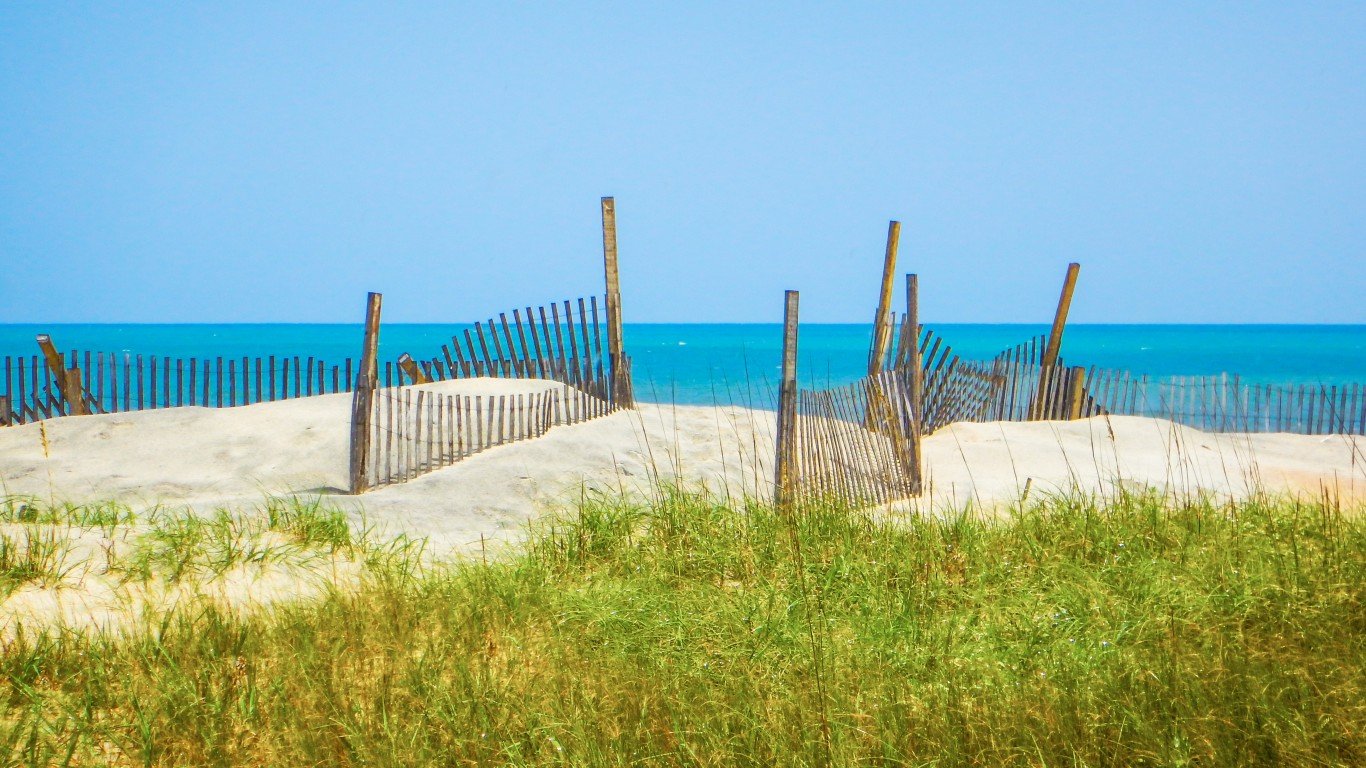
2. Back Bay Beach, Virginia Beach County, VA
> Avg. annual beach loss: -41.1%
> Beach length 2014: 10.8 miles
> Beach length 2018: 1.3 miles (-88.0%)
> Area population change (2013-2017): 442,151 to 450,057 (+0.0%)
> Avg. monthly precipitation: 3.78 inches
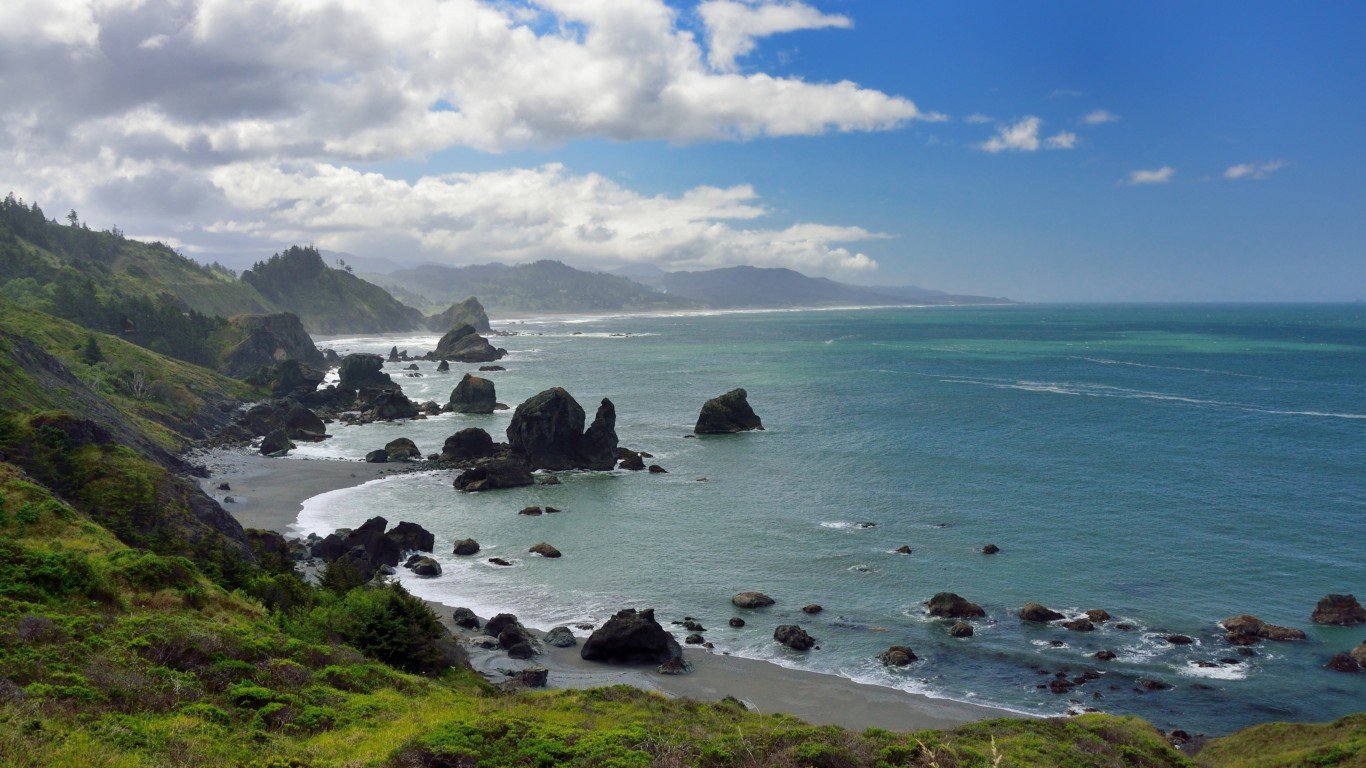
1. Nesika Beach, Curry County, OR
> Avg. annual beach loss: -47.9%
> Beach length 2007: 51.0 miles
> Beach length 2011: 3.8 miles (-92.6%)
> Area population change (2013-2017): 22,361 to 22,377 (+0.1%)
> Avg. monthly precipitation: 8.35 inches


