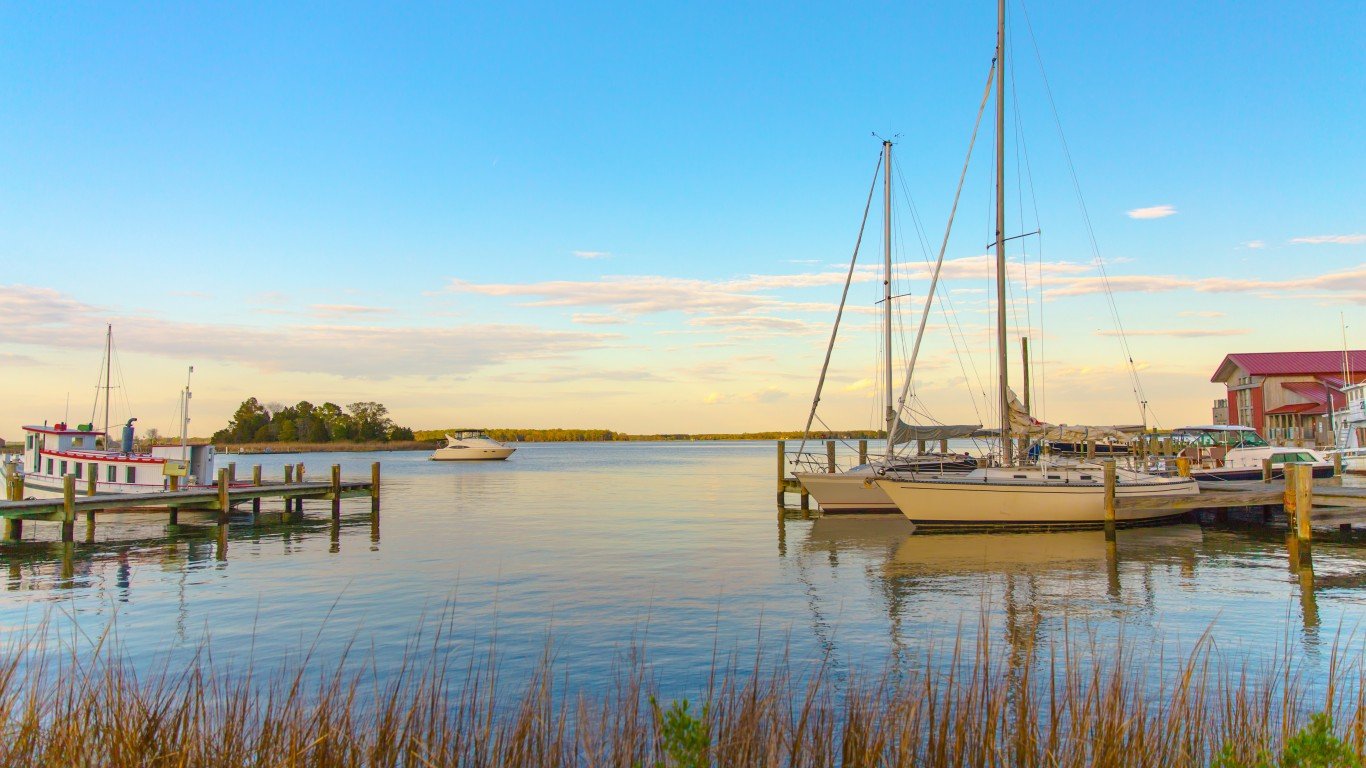
Source: Kruck20 / iStock via Getty Images
40. Tennessee
>Percent of bridges that are structurally deficient: 4.1%
>Number of bridges: 20,331

Source: Davel5957 / E+ via Getty Images
39. Minnesota
>Percent of bridges that are structurally deficient: 4.6%
>Number of bridges: 13,496

Source: Sean Pavone / iStock via Getty Images
38. Oregon
>Percent of bridges that are structurally deficient: 4.6%
>Number of bridges: 8,235

Source: ymn / iStock via Getty Images
37. Maryland
>Percent of bridges that are structurally deficient: 4.7%
>Number of bridges: 5,446

Source: aiisha5 / iStock via Getty Images
36. Washington
>Percent of bridges that are structurally deficient: 4.8%
>Number of bridges: 8,358

 24/7 Tempo


