Source: Dreamframer / iStock via Getty Images
50. Arizona
>Percent of bridges that are structurally deficient: 1.4%
>Number of bridges: 8,467

Source: photoquest7 / iStock via Getty Images
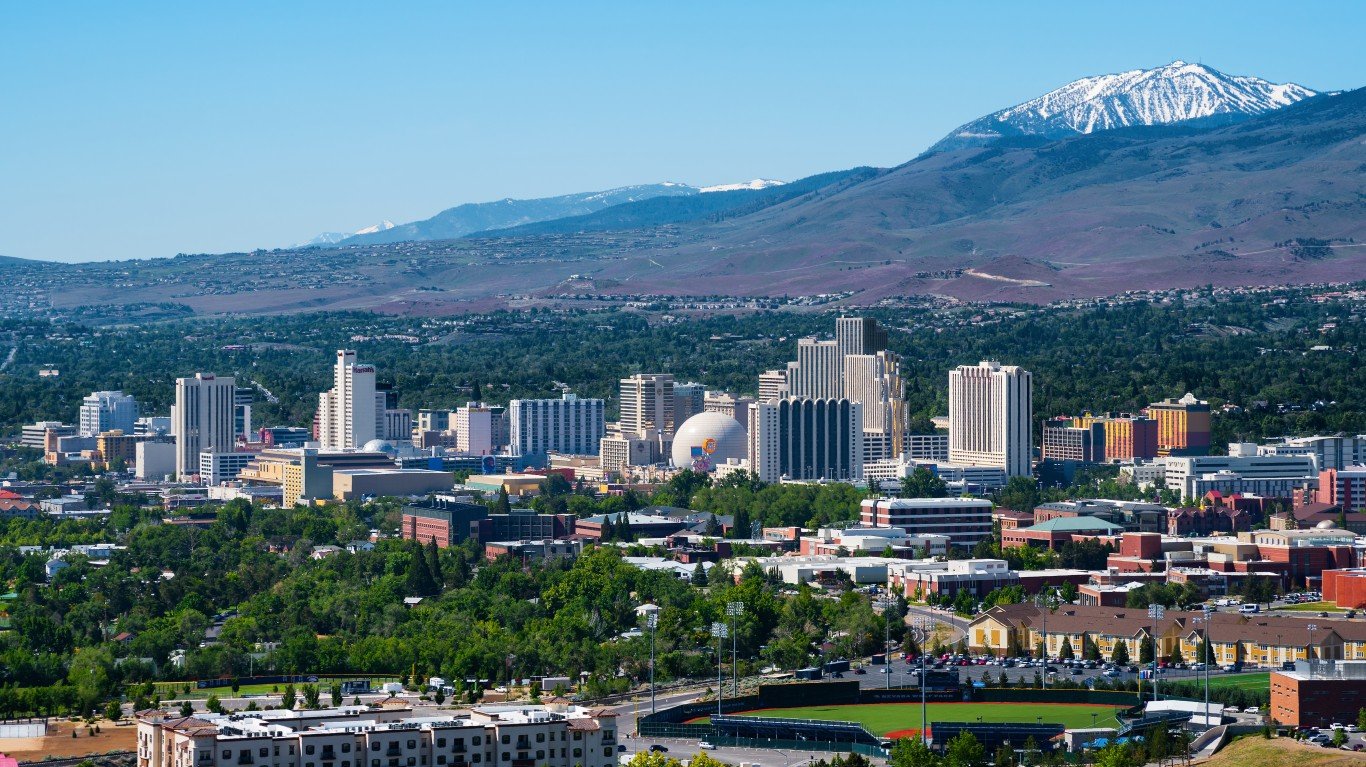
49. Nevada
>Percent of bridges that are structurally deficient: 1.4%
>Number of bridges: 2,067
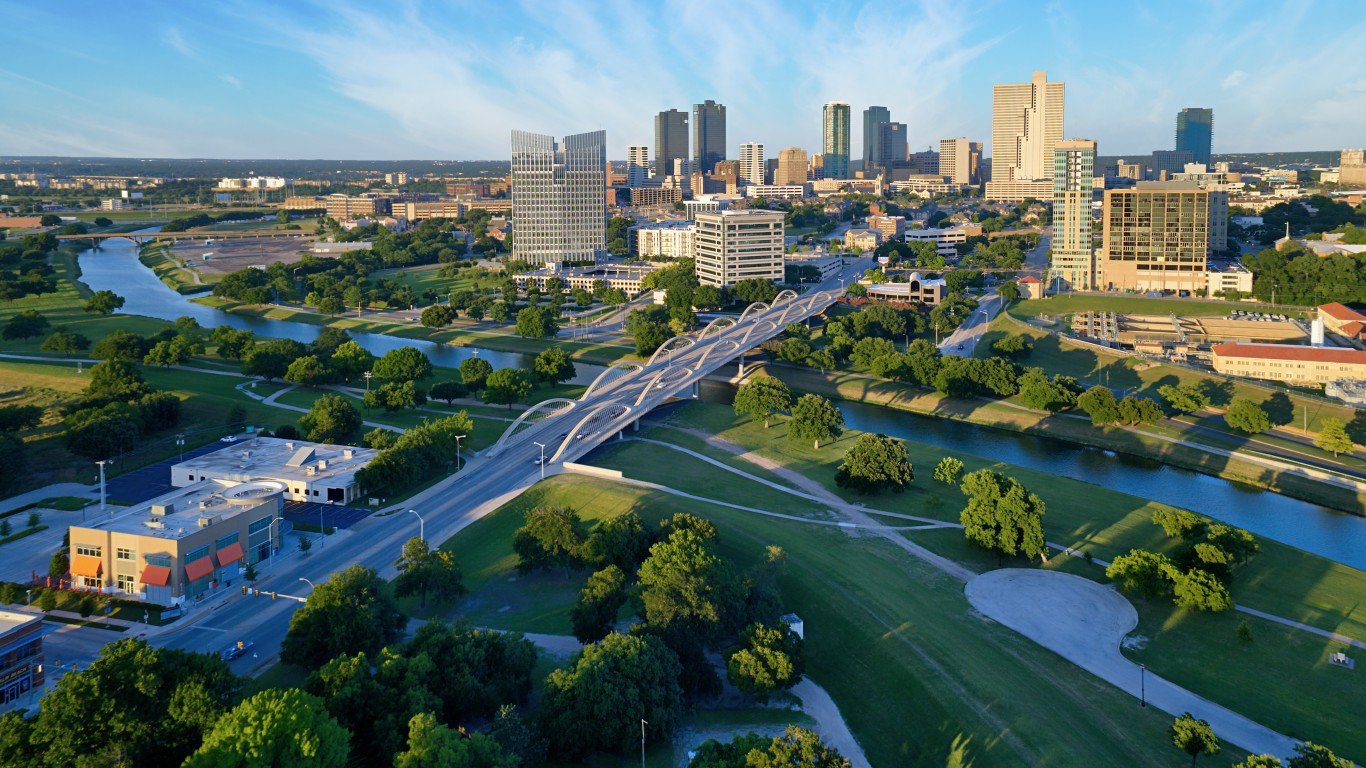
48. Texas
>Percent of bridges that are structurally deficient: 1.4%
>Number of bridges: 55,175

Source: DenisTangneyJr / iStock via Getty Images
47. Delaware
>Percent of bridges that are structurally deficient: 1.9%
>Number of bridges: 875

Source: Kruck20 / iStock via Getty Images
46. Utah
>Percent of bridges that are structurally deficient: 2.1%
>Number of bridges: 3,056


