
5. New Haven, CT
> Fine particulate matter pollution 24-hr average: 23 µg/m3 (EPA standard: 35 µg/m3)
> Avg. nitrogen dioxide concentration: 11 ppb (EPA standard: 53 ppb)
> Total population: 855,733
> Fall 2022 allergy ranking: #9 out of 100


4. Hartford, CT
> Fine particulate matter pollution 24-hr average: 20 µg/m3 (EPA standard: 35 µg/m3)
> Avg. nitrogen dioxide concentration: 12 ppb (EPA standard: 53 ppb)
> Total population: 1,205,842
> Fall 2022 allergy ranking: #8 out of 100
 24/7 Tempo
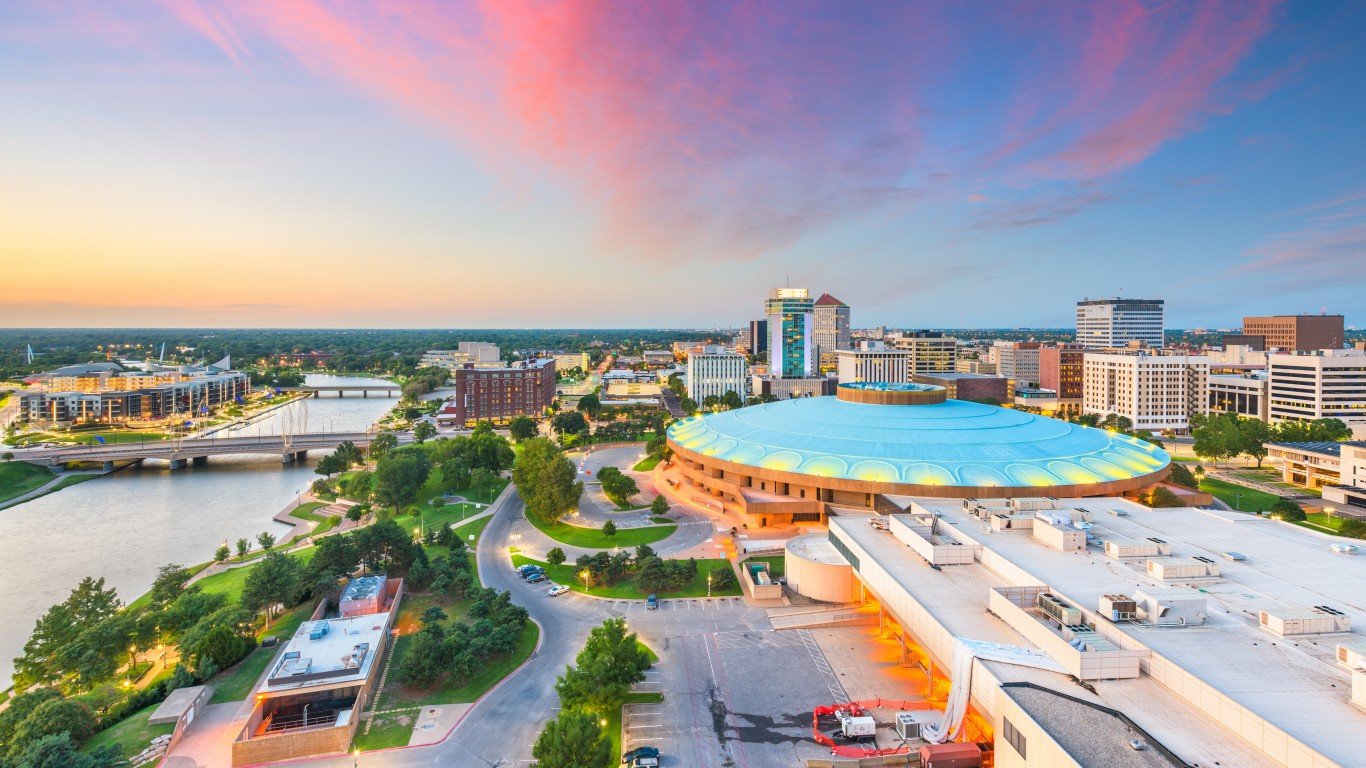
3. Wichita, KS
> Fine particulate matter pollution 24-hr average: 24 µg/m3 (EPA standard: 35 µg/m3)
> Avg. nitrogen dioxide concentration: 6 ppb (EPA standard: 53 ppb)
> Total population: 639,668
> Fall 2022 allergy ranking: #2 out of 100

2. Richmond, VA
> Fine particulate matter pollution 24-hr average: 15 µg/m3 (EPA standard: 35 µg/m3)
> Avg. nitrogen dioxide concentration: 12 ppb (EPA standard: 53 ppb)
> Total population: 1,282,067
> Fall 2022 allergy ranking: #10 out of 100
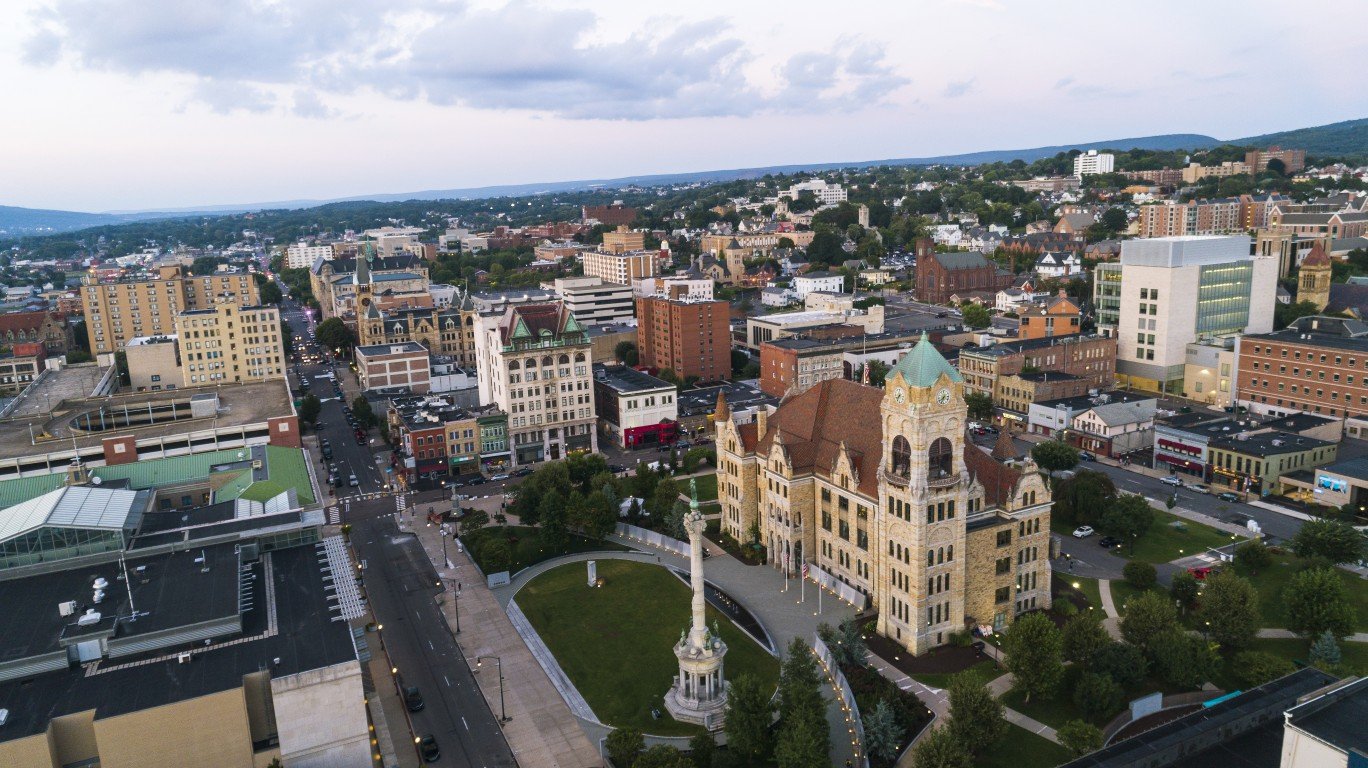
1. Scranton, PA
> Fine particulate matter pollution 24-hr average: 19 µg/m3 (EPA standard: 35 µg/m3)
> Avg. nitrogen dioxide concentration: 9 ppb (EPA standard: 53 ppb)
> Total population: 554,787
> Fall 2022 allergy ranking: #1 out of 100


