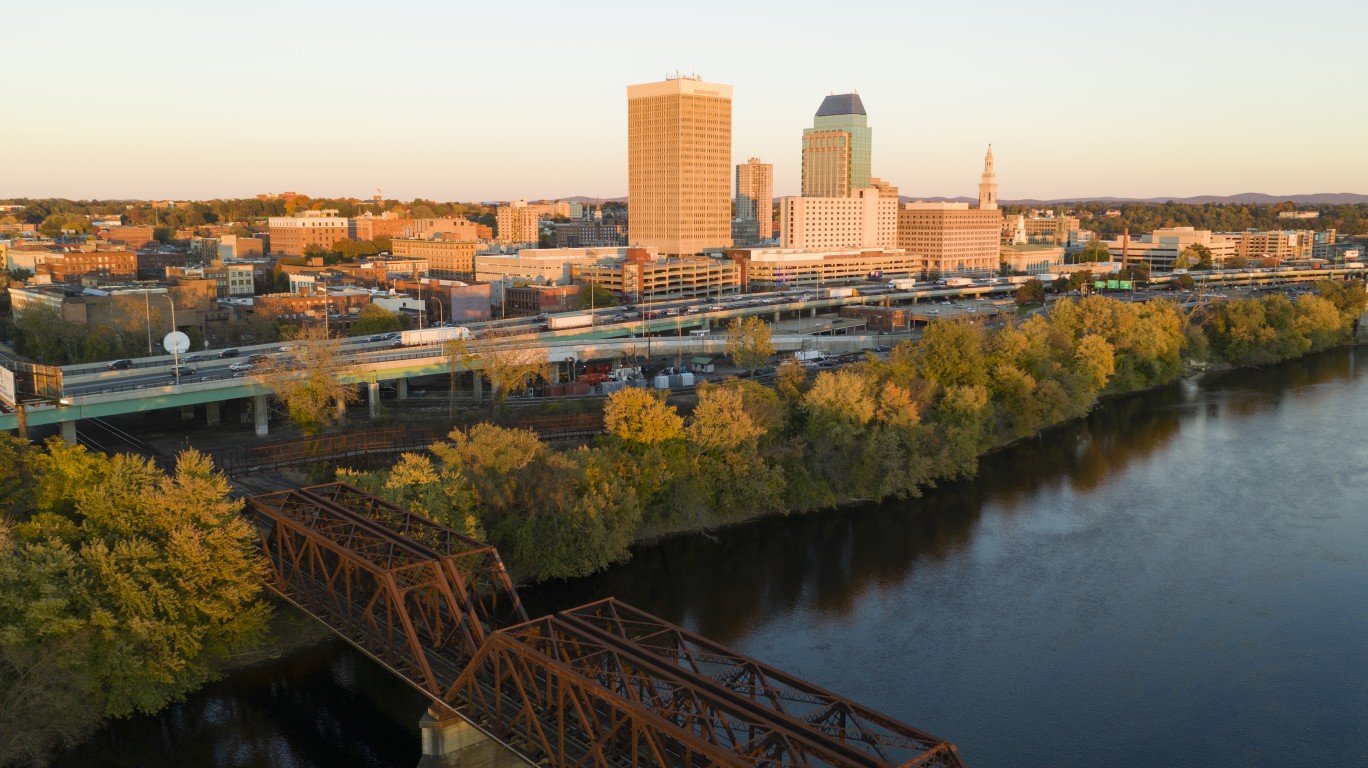
10. Springfield, MA
> Fine particulate matter pollution 24-hr average: 22 µg/m3 (EPA standard: 35 µg/m3)
> Avg. nitrogen dioxide concentration: 10 ppb (EPA standard: 53 ppb)
> Total population: 698,537
> Fall 2022 allergy ranking: #15 out of 100

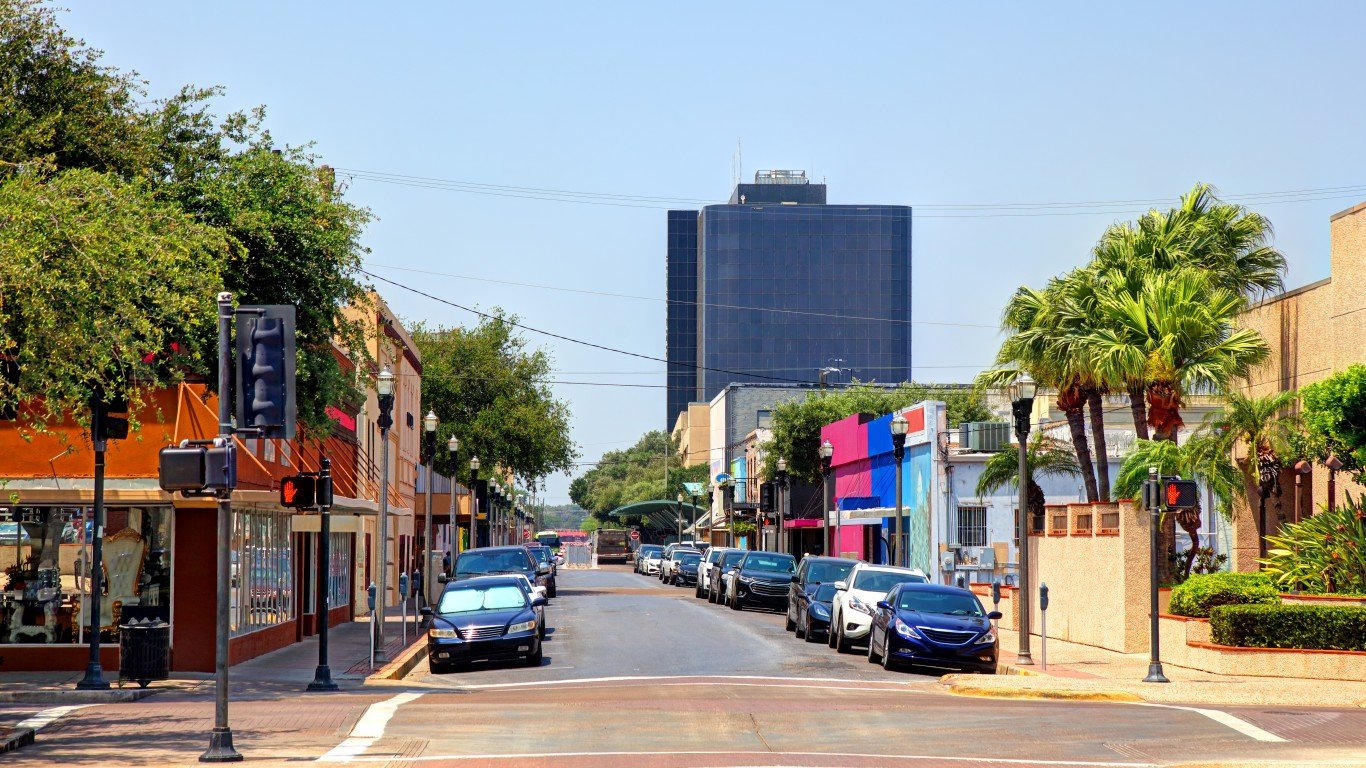
9. McAllen, TX
> Fine particulate matter pollution 24-hr average: 33 µg/m3 (EPA standard: 35 µg/m3)
> Avg. nitrogen dioxide concentration: . ppb (EPA standard: 53 ppb)
> Total population: 861,137
> Fall 2022 allergy ranking: #3 out of 100
 24/7 Tempo
8. Bridgeport, CT
> Fine particulate matter pollution 24-hr average: 25 µg/m3 (EPA standard: 35 µg/m3)
> Avg. nitrogen dioxide concentration: 8 ppb (EPA standard: 53 ppb)
> Total population: 944,306
> Fall 2022 allergy ranking: #14 out of 100

7. Albany, NY
> Fine particulate matter pollution 24-hr average: 23 µg/m3 (EPA standard: 35 µg/m3)
> Avg. nitrogen dioxide concentration: . ppb (EPA standard: 53 ppb)
> Total population: 880,766
> Fall 2022 allergy ranking: #11 out of 100

6. Oklahoma City, OK
> Fine particulate matter pollution 24-hr average: 25 µg/m3 (EPA standard: 35 µg/m3)
> Avg. nitrogen dioxide concentration: 11 ppb (EPA standard: 53 ppb)
> Total population: 1,397,040
> Fall 2022 allergy ranking: #5 out of 100


