
25. St. Louis, MO
> Fine particulate matter pollution 24-hr average: 26 µg/m3 (EPA standard: 35 µg/m3)
> Avg. nitrogen dioxide concentration: 10 ppb (EPA standard: 53 ppb)
> Total population: 2,806,349
> Fall 2022 allergy ranking: #36 out of 100


24. Tulsa, OK
> Fine particulate matter pollution 24-hr average: 20 µg/m3 (EPA standard: 35 µg/m3)
> Avg. nitrogen dioxide concentration: 6 ppb (EPA standard: 53 ppb)
> Total population: 996,141
> Fall 2022 allergy ranking: #21 out of 100

23. Grand Rapids, MI
> Fine particulate matter pollution 24-hr average: 18 µg/m3 (EPA standard: 35 µg/m3)
> Avg. nitrogen dioxide concentration: 5 ppb (EPA standard: 53 ppb)
> Total population: 1,069,696
> Fall 2022 allergy ranking: #25 out of 100

22. Las Vegas, NV
> Fine particulate matter pollution 24-hr average: 33 µg/m3 (EPA standard: 35 µg/m3)
> Avg. nitrogen dioxide concentration: 23 ppb (EPA standard: 53 ppb)
> Total population: 2,228,866
> Fall 2022 allergy ranking: #20 out of 100
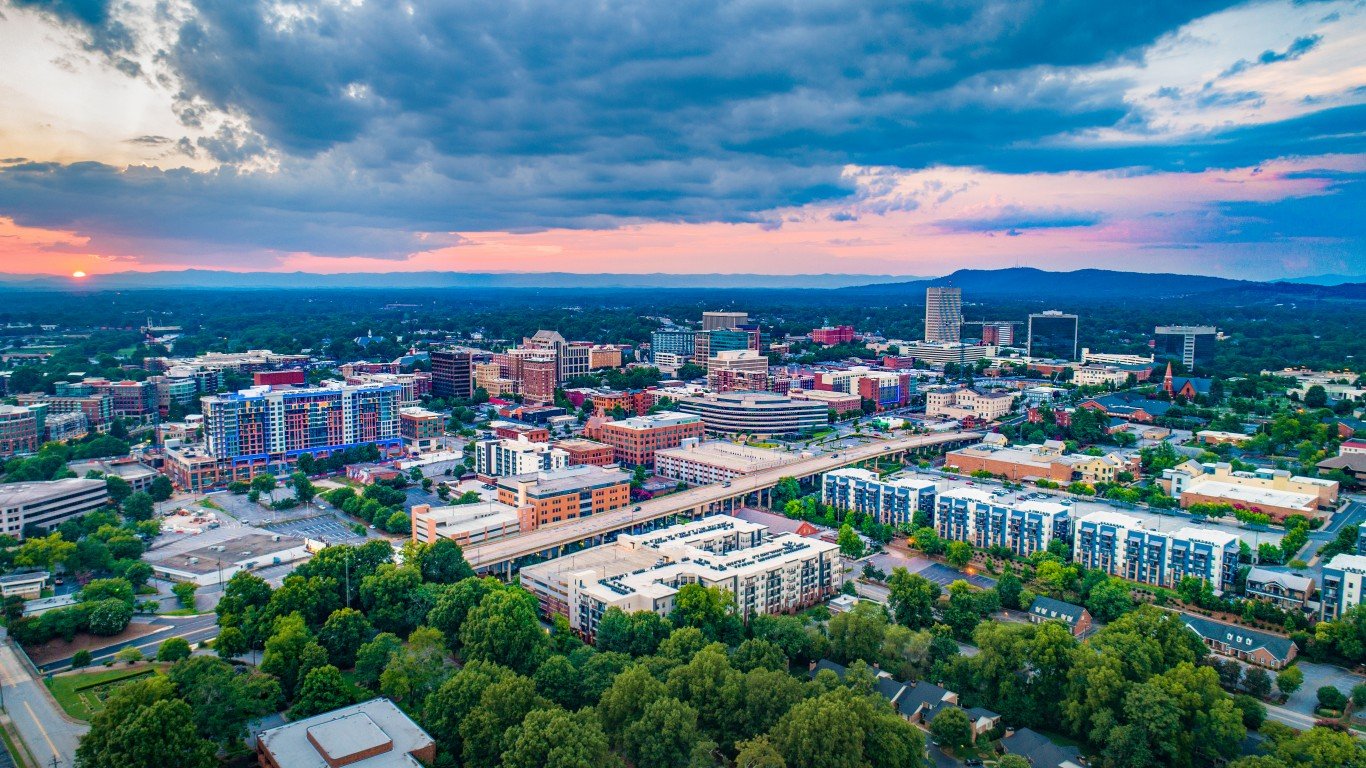
21. Greenville, SC
> Fine particulate matter pollution 24-hr average: 20 µg/m3 (EPA standard: 35 µg/m3)
> Avg. nitrogen dioxide concentration: 6 ppb (EPA standard: 53 ppb)
> Total population: 908,680
> Fall 2022 allergy ranking: #28 out of 100


