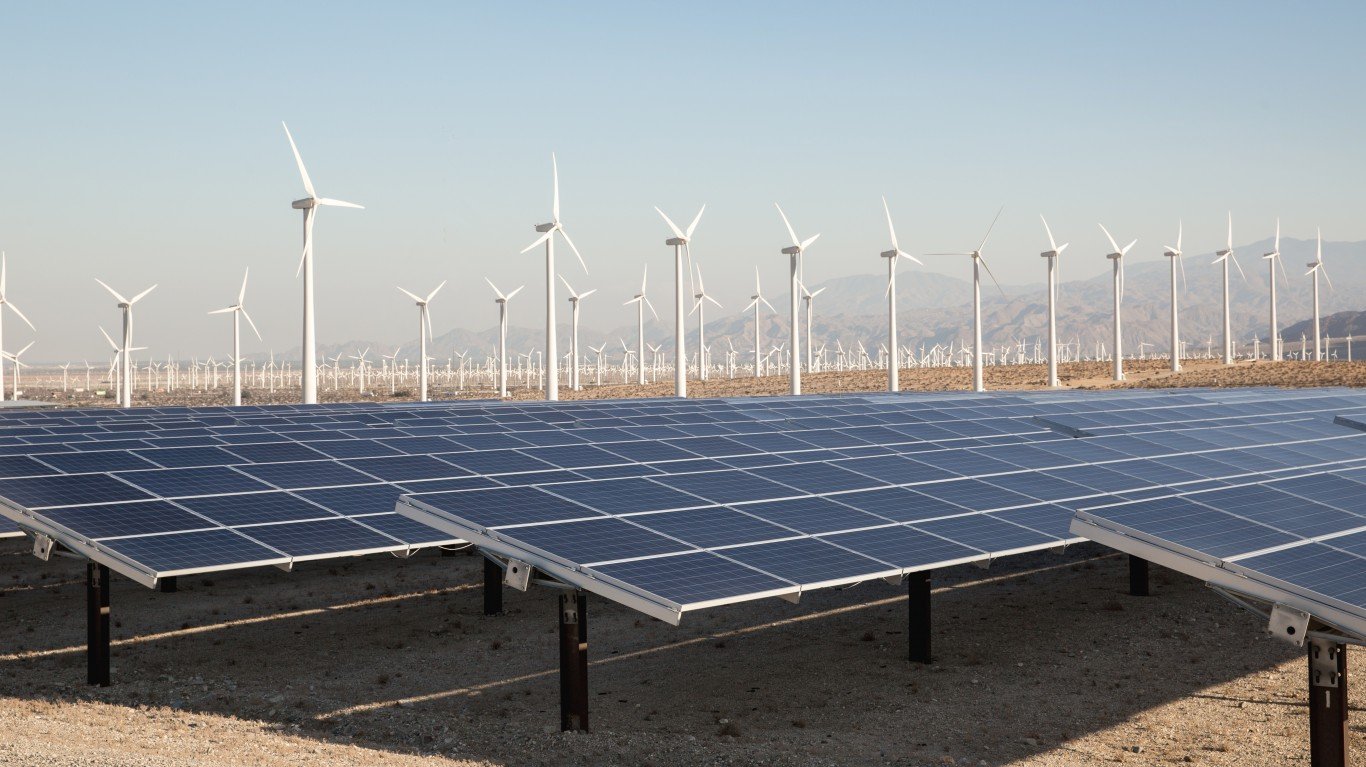
23. California
> Potential jobs created under Inflation Reduction Act in 2030: 1 for every 286 people (140,005 total)
> Potential new jobs as a share of current unemployed population: 17.3%
> Unemployed population in 2022: 811,079 (4.2% of labor force)
> Energy-related carbon dioxide emissions in 2021: 8.3 metric tons per person (44.1% lower than avg.)

22. Maryland
> Potential jobs created under Inflation Reduction Act in 2030: 1 for every 283 people (22,117 total)
> Potential new jobs as a share of current unemployed population: 21.5%
> Unemployed population in 2022: 102,813 (3.2% of labor force)
> Energy-related carbon dioxide emissions in 2021: 8.5 metric tons per person (42.5% lower than avg.)

21. Massachusetts
> Potential jobs created under Inflation Reduction Act in 2030: 1 for every 282 people (25,290 total)
> Potential new jobs as a share of current unemployed population: 18.0%
> Unemployed population in 2022: 140,752 (3.8% of labor force)
> Energy-related carbon dioxide emissions in 2021: 8.0 metric tons per person (45.8% lower than avg.)

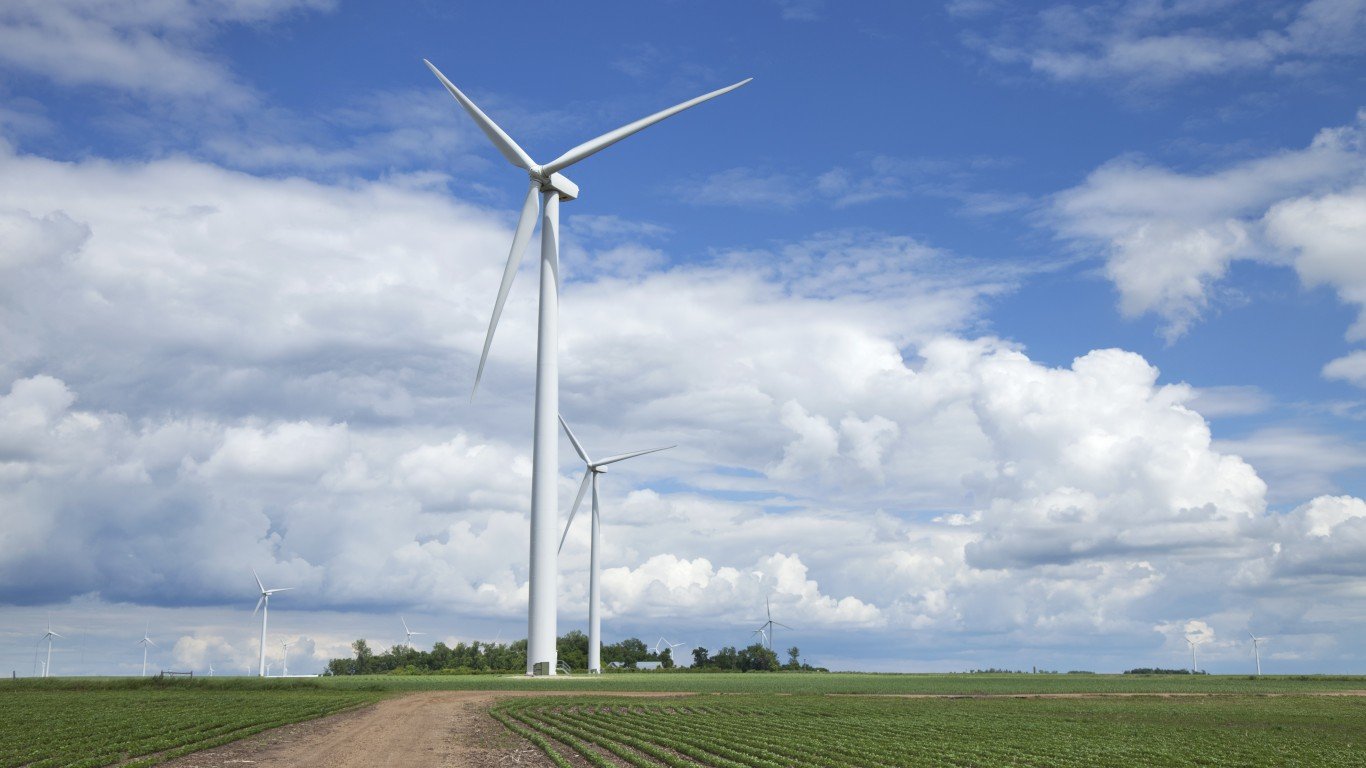
20. Nebraska
> Potential jobs created under Inflation Reduction Act in 2030: 1 for every 282 people (7,060 total)
> Potential new jobs as a share of current unemployed population: 28.4%
> Unemployed population in 2022: 24,836 (2.3% of labor force)
> Energy-related carbon dioxide emissions in 2021: 24.0 metric tons per person (62.5% higher than avg.)

19. Minnesota
> Potential jobs created under Inflation Reduction Act in 2030: 1 for every 281 people (20,588 total)
> Potential new jobs as a share of current unemployed population: 24.9%
> Unemployed population in 2022: 82,580 (2.7% of labor force)
> Energy-related carbon dioxide emissions in 2021: 14.6 metric tons per person (1.6% lower than avg.)


