2010
> Average land-ocean temperature: 58.3° Fahrenheit – #9 highest
> Anomaly from 1951-1980 avg: 1.30° above 57° Fahrenheit
> Hottest month: March (58.7°)
2011
> Average land-ocean temperature: 58.1° Fahrenheit – #18 highest
> Anomaly from 1951-1980 avg: 1.10° above 57° Fahrenheit
> Hottest month: August (58.3°)
2012
> Average land-ocean temperature: 58.2° Fahrenheit – #13 highest
> Anomaly from 1951-1980 avg: 1.17° above 57° Fahrenheit
> Hottest month: October (58.4°)
2013
> Average land-ocean temperature: 58.2° Fahrenheit – #10 highest
> Anomaly from 1951-1980 avg: 1.21° above 57° Fahrenheit
> Hottest month: November (58.5°)
2014
> Average land-ocean temperature: 58.3° Fahrenheit – #8 highest
> Anomaly from 1951-1980 avg: 1.33° above 57° Fahrenheit
> Hottest month: September (58.6°)
2015
> Average land-ocean temperature: 58.6° Fahrenheit – #5 highest
> Anomaly from 1951-1980 avg: 1.60° above 57° Fahrenheit
> Hottest month: December (59.1°)
2016
> Average land-ocean temperature: 58.8° Fahrenheit – #2 highest
> Anomaly from 1951-1980 avg: 1.82° above 57° Fahrenheit
> Hottest month: February (59.5°)
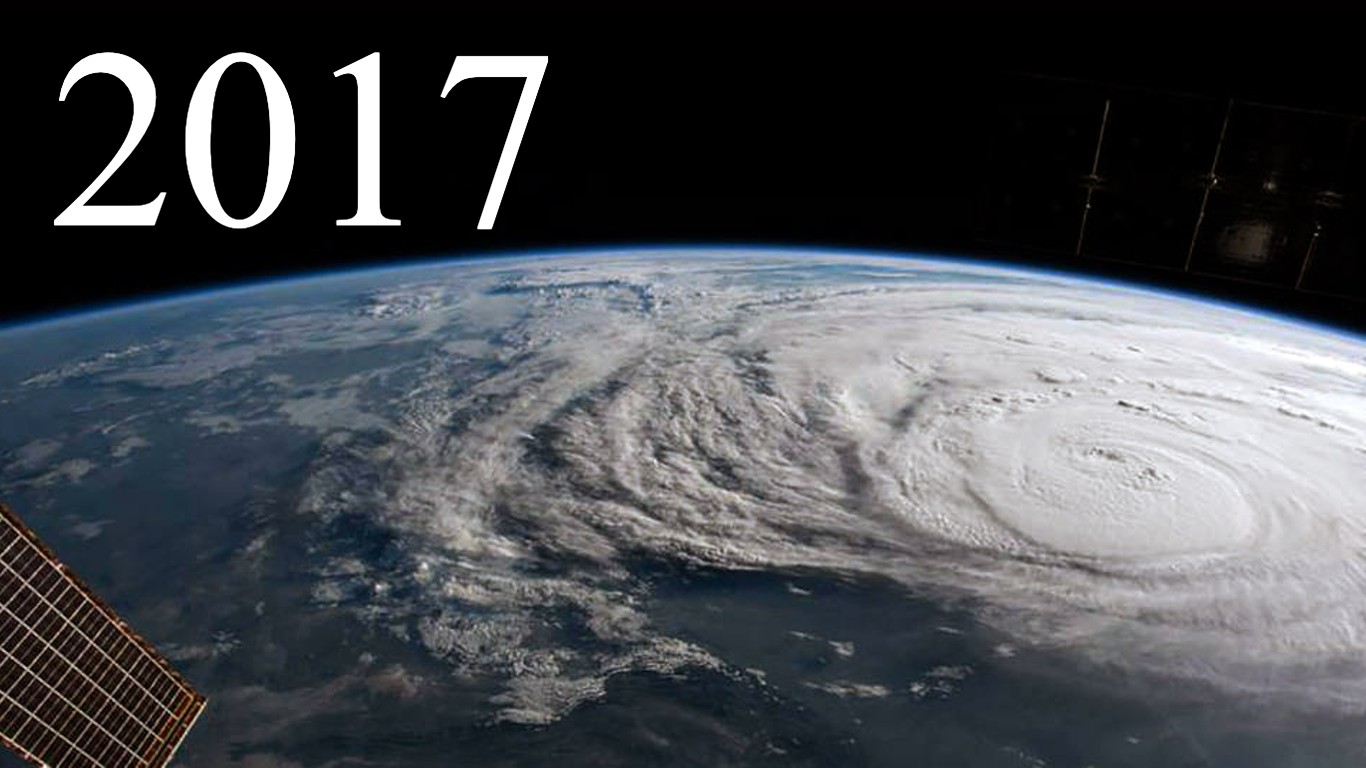
2017
> Average land-ocean temperature: 58.7° Fahrenheit – #4 highest
> Anomaly from 1951-1980 avg: 1.66° above 57° Fahrenheit
> Hottest month: March (59.1°)
2018
> Average land-ocean temperature: 58.5° Fahrenheit – #6 highest
> Anomaly from 1951-1980 avg: 1.51° above 57° Fahrenheit
> Hottest month: October (58.8°)
2019
> Average land-ocean temperature: 58.7° Fahrenheit – #3 highest
> Anomaly from 1951-1980 avg: 1.75° above 57° Fahrenheit
> Hottest month: March (59.1°)


