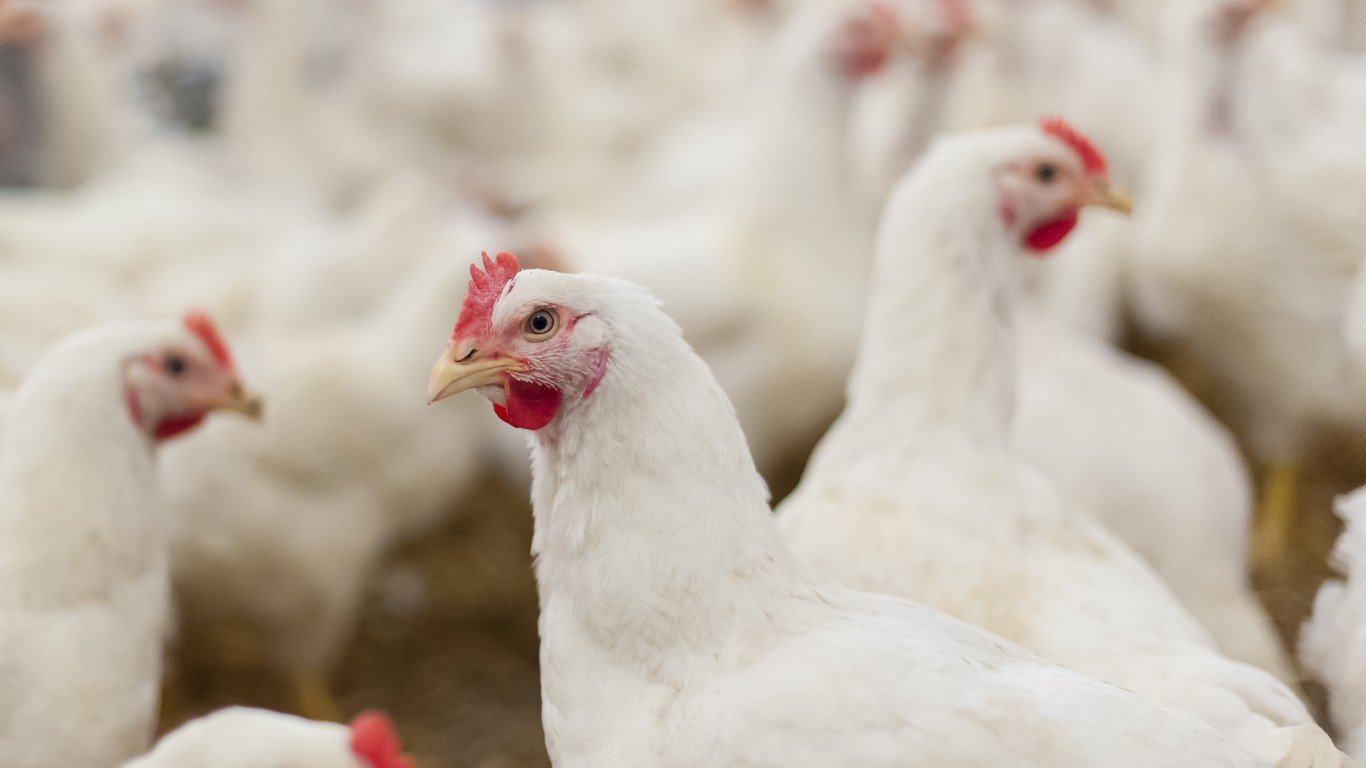
10. Poultry Meat
> GHG emissions in kg of CO2 equivalents per 1 kg of food: 9.9
> GHG emissions in kg of CO2 equivalents per nutritional unit: 5.7 per 100 g protein (10th highest)
> Land use in sq meters per 1 kg of food: 12.2 (12th highest)
> Freshwater withdrawal in liters per 1 kg of food: 660.0 (13th highest)

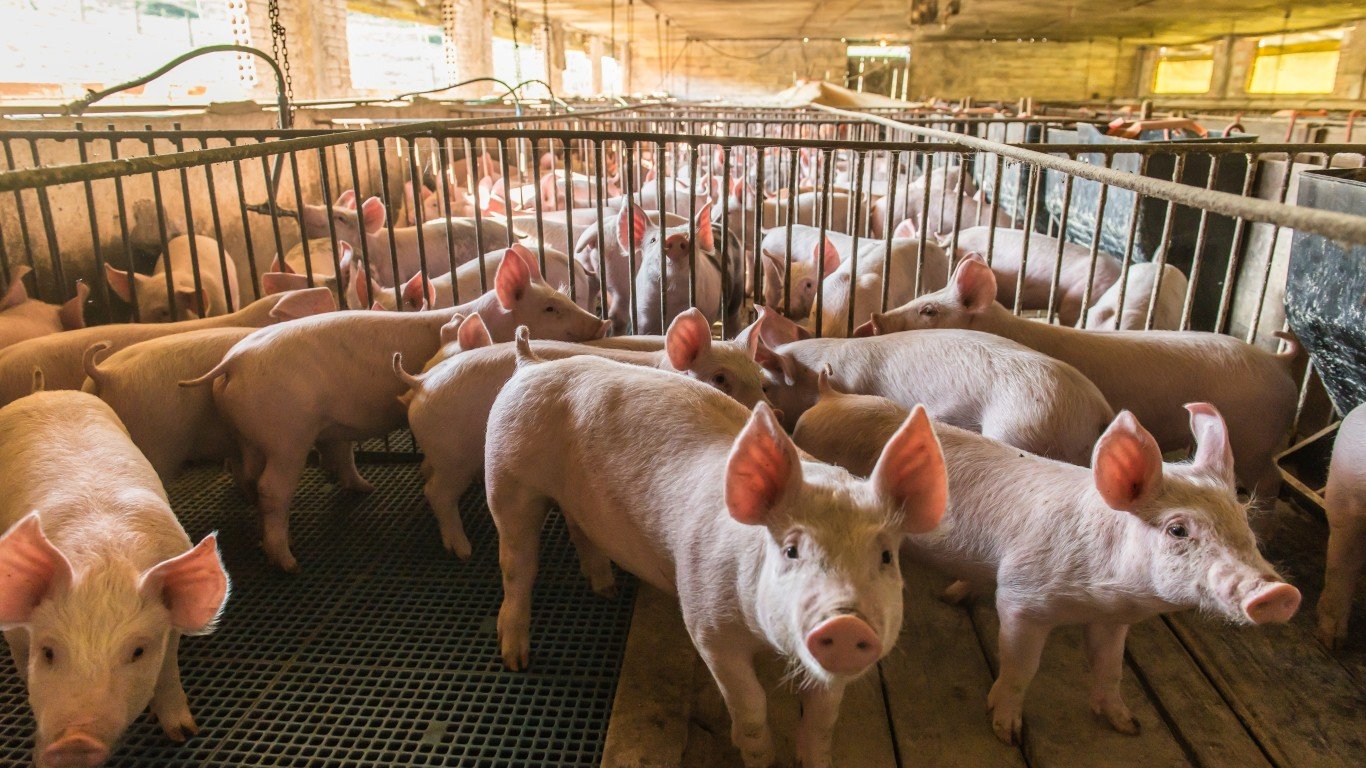
9. Pig Meat
> GHG emissions in kg of CO2 equivalents per 1 kg of food: 12.3
> GHG emissions in kg of CO2 equivalents per nutritional unit: 7.6 per 100 g protein (6th highest)
> Land use in sq meters per 1 kg of food: 17.4 (9th highest)
> Freshwater withdrawal in liters per 1 kg of food: 1,795.8 (10th highest)
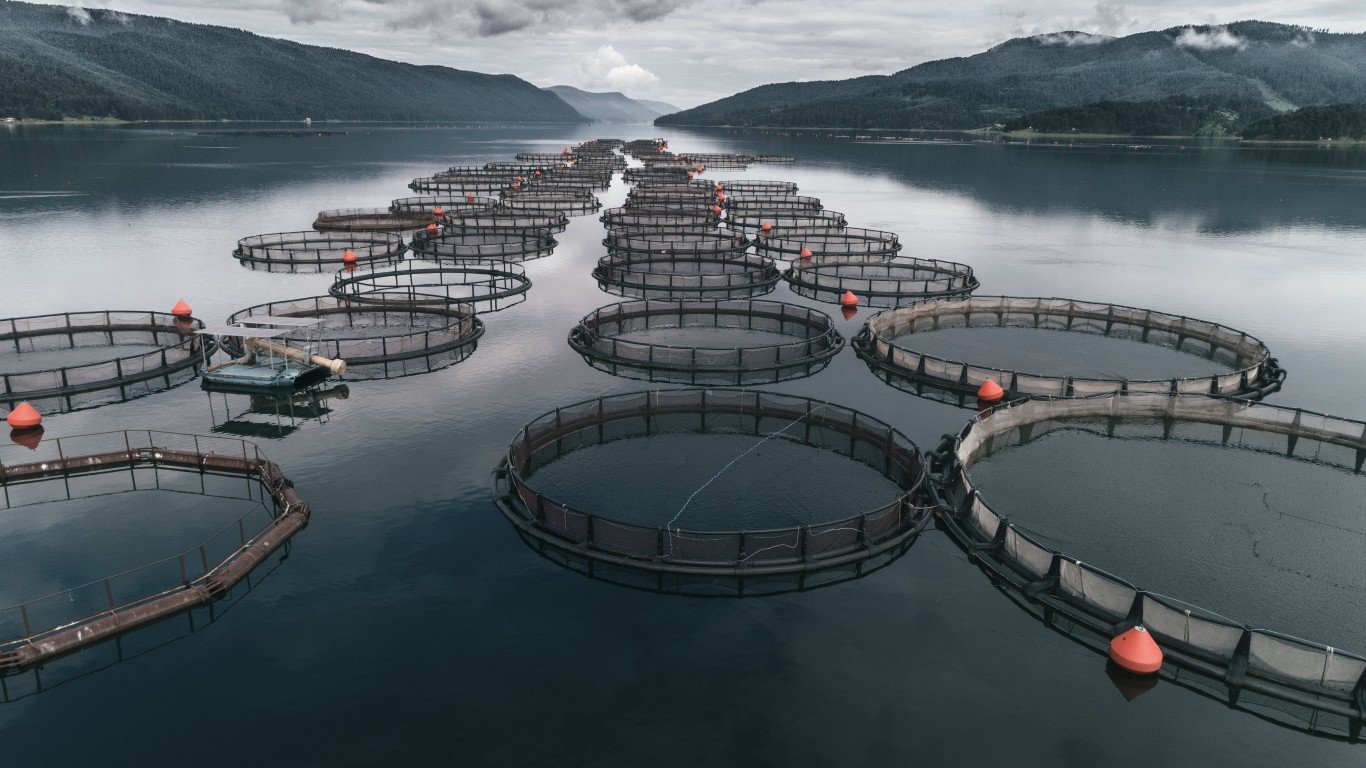
8. Fish (farmed)
> GHG emissions in kg of CO2 equivalents per 1 kg of food: 13.6
> GHG emissions in kg of CO2 equivalents per nutritional unit: 6.0 per 100 g protein (9th highest)
> Land use in sq meters per 1 kg of food: 8.4 (17th highest)
> Freshwater withdrawal in liters per 1 kg of food: 3,691.3 (3rd highest)

7. Cheese
> GHG emissions in kg of CO2 equivalents per 1 kg of food: 23.9
> GHG emissions in kg of CO2 equivalents per nutritional unit: 10.8 per 100 g protein (5th highest)
> Land use in sq meters per 1 kg of food: 87.8 (3rd highest)
> Freshwater withdrawal in liters per 1 kg of food: 5,605.2 (the highest)
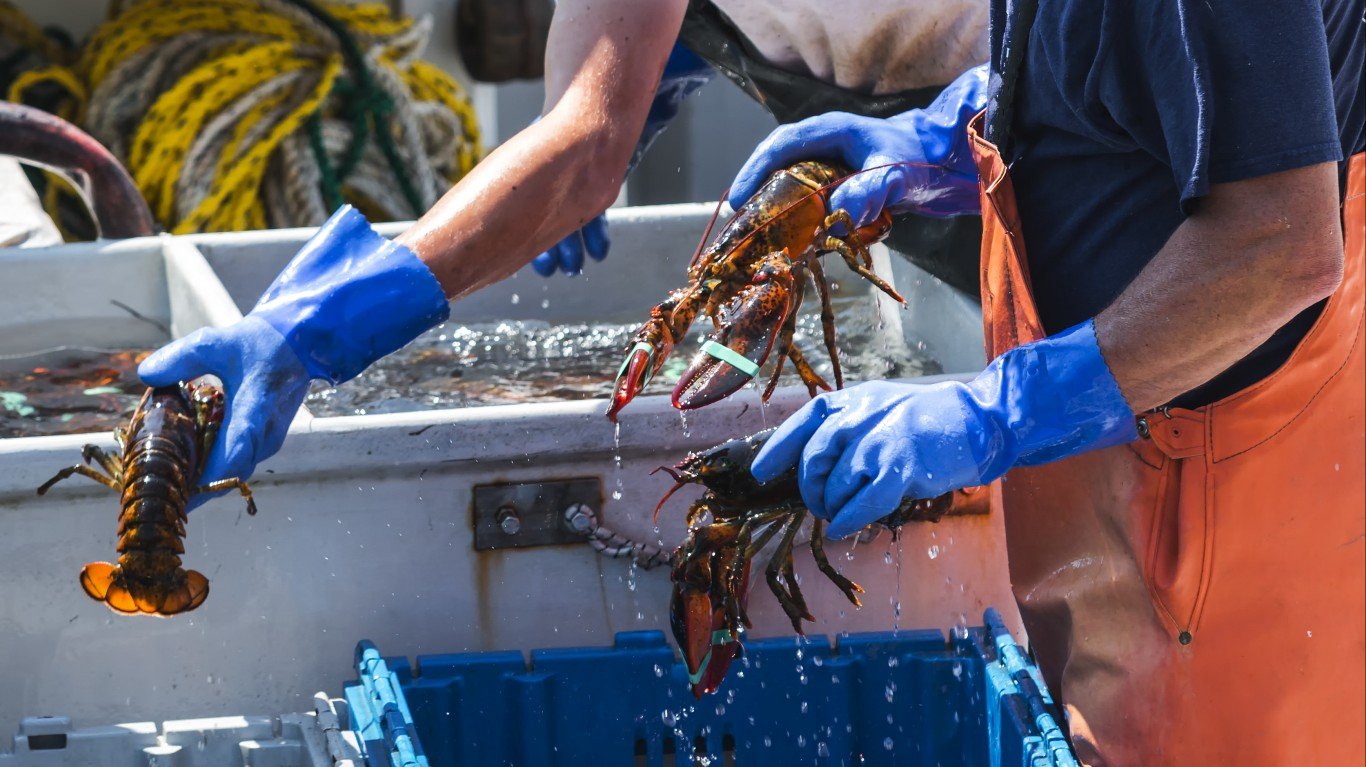
6. Crustaceans (farmed)
> GHG emissions in kg of CO2 equivalents per 1 kg of food: 26.9
> GHG emissions in kg of CO2 equivalents per nutritional unit: 18.2 per 100 g protein (3rd highest)
> Land use in sq meters per 1 kg of food: 3.0 (7th lowest)
> Freshwater withdrawal in liters per 1 kg of food: 3,515.4 (4th highest)


