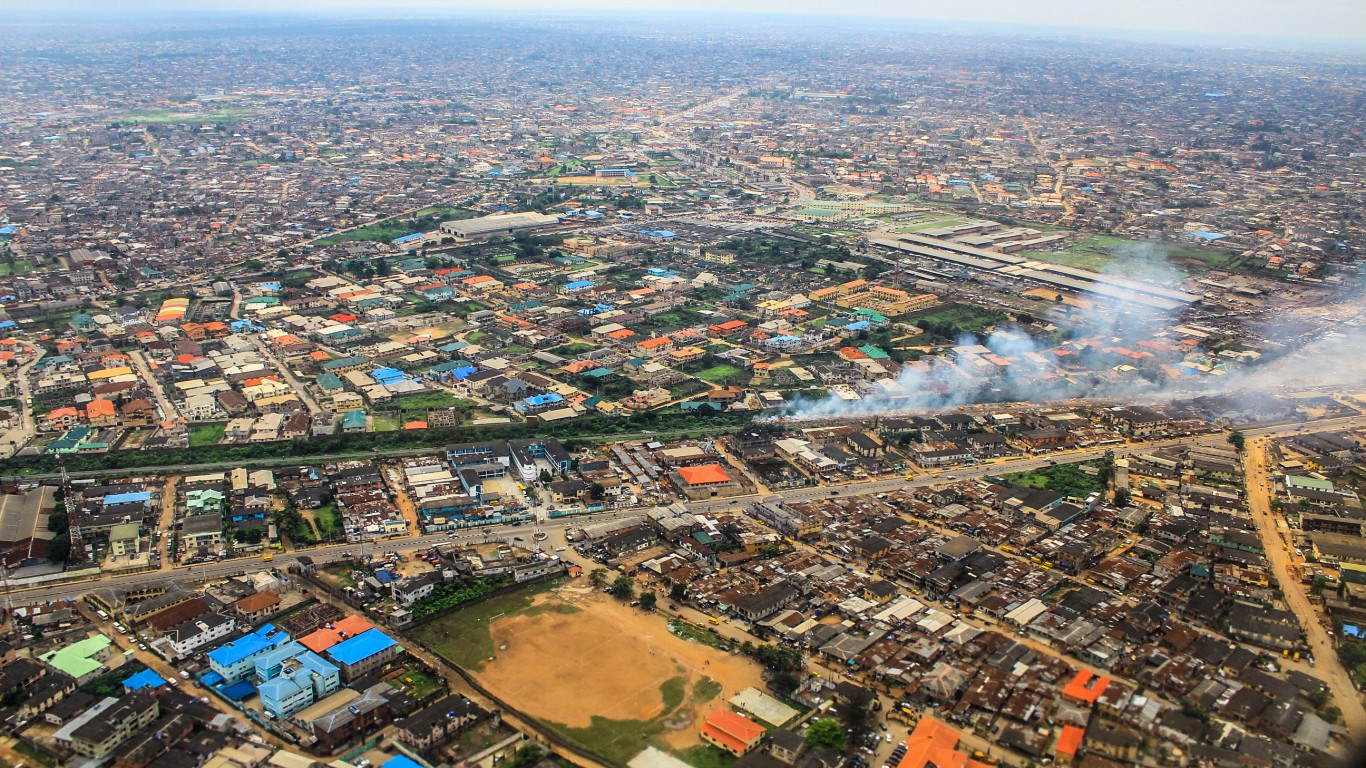
10. Nigeria
> 10-year chg. in EPI score: -6.1
> 2022 score: 28.3 – #162 out of 180
> 2012 score: 34.4 – #120 out of 178
> GDP per capita: $2,097 – #162 out of 213
> Population: 206.1 million – #7 out of 217


9. Zambia
> 10-year chg. in EPI score: -6.9
> 2022 score: 38.4 – #106 out of 180
> 2012 score: 45.3 – #56 out of 178
> GDP per capita: $985 – #188 out of 213
> Population: 18.4 million – #64 out of 217
 24/7 Tempo
8. Samoa
> 10-year chg. in EPI score: -7.4
> 2022 score: 36.4 – #122 out of 180
> 2012 score: 43.8 – #63 out of 178
> GDP per capita: $4,068 – #133 out of 213
> Population: 0.2 million – #182 out of 217

7. Philippines
> 10-year chg. in EPI score: -7.5
> 2022 score: 28.9 – #158 out of 180
> 2012 score: 36.4 – #103 out of 178
> GDP per capita: $3,299 – #146 out of 213
> Population: 109.6 million – #13 out of 217

6. Bhutan
> 10-year chg. in EPI score: -7.9
> 2022 score: 42.5 – #85 out of 180
> 2012 score: 50.4 – #32 out of 178
> GDP per capita: $3,001 – #151 out of 213
> Population: 0.8 million – #164 out of 217


