Home Blog Page 65

People in This State Can’t Pay Their Energy Bills

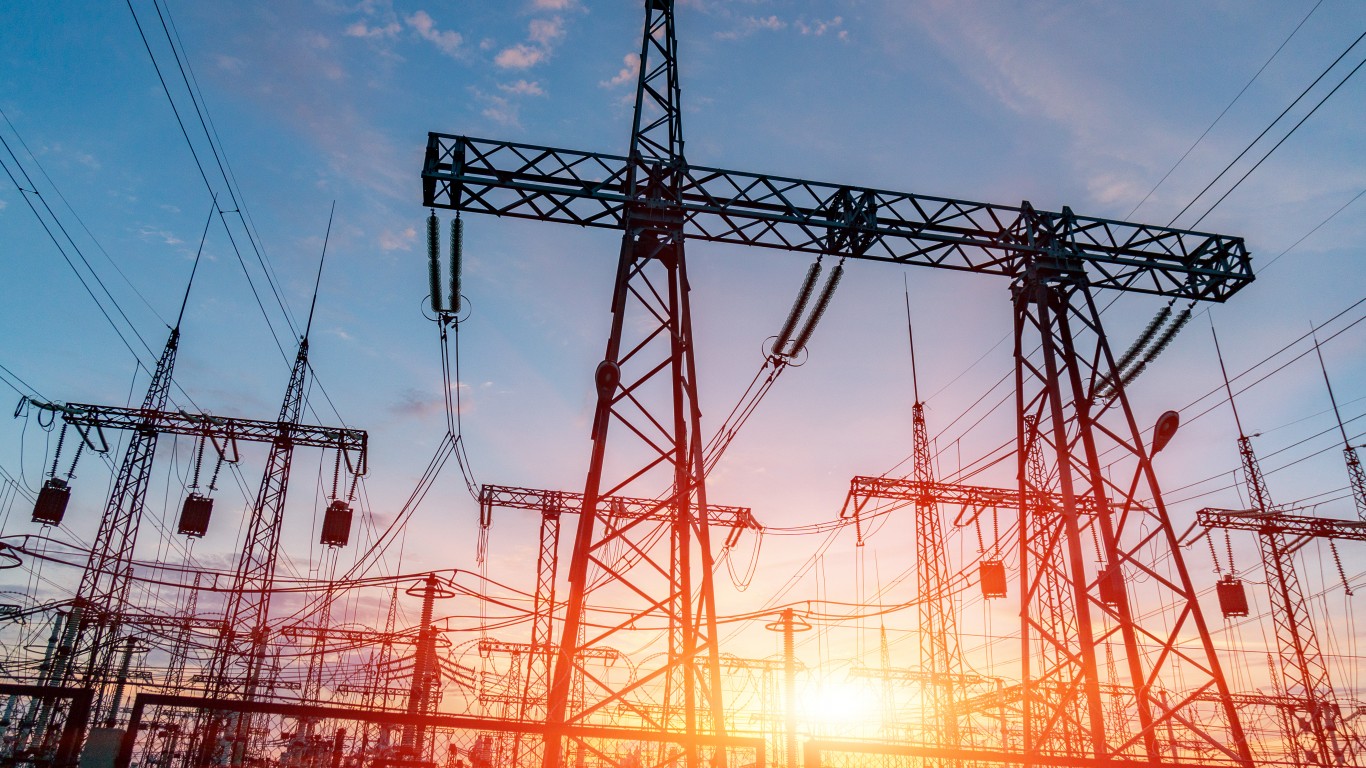
Source: Yelantsevv / iStock via Getty Images

At least two things have happened to affect the ability of people to pay their energy bills since COVID-19 began. And in Texas — the state where the most people struggle with energy bills — one more thing did.

Nationwide, millions of people are still out of work. According to the Bureau of Labor Statistics, 7.4 million people were unemployed in October. Also, the cost of most forms of energy used to heat and cool homes has risen. Natural gas prices in the United States have doubled this year, and crude oil prices are up by even more.

To measure the effects of the COVID-19 pandemic on American life, the U.S. Census Bureau began conducting the Household Pulse Survey in April 2020. A number of other federal agencies participate — Bureau of Labor Statistics, Bureau of Transportation Statistics, Centers for Disease Control and Prevention, Consumer Financial Protection Bureau, Department of Defense, Energy Information Administration, Department of Health and Human Services, Department of Housing and Urban Development, Maternal and Child Health Bureau, National Center for Education Statistics, National Center for Health Statistics, National Institute for Occupational Safety and Health, and USDA Economic Research Service.

The survey is reported in waves, dubbed weeks. The current “week,” week 39, covers the period from Sept. 29, 2021 through Oct. 11, 2021. The data are reported by state and major metropolitan areas. 

Among the subjects covered are changes in education, child care disruptions, loss of employment, working remotely, whether people have enough to eat, whether people have been vaccinated, whether they can pay mortgages or rent, and whether people are unable to pay their energy bills. The last of these reports the number, and percentage, of adults in households that were unable to pay an energy bill in full in the last 12 months.

The state where the most people struggle with energy bills is Texas, where 27.9% of adults lived in households that were unable to pay an energy bill in full. This compares to a national average of 20.1%. The survey does not give a reason. However, a huge winter storm that hit the state in February caused a spike in the price of electricity in the state.

In its Winter Fuels Outlook, the EIA has forecast that nearly half of U.S. households that heat primarily with natural gas will spend 30% more on average than they spent last winter. If the winter is 10% colder than average, that figure would jump to 50% more, and if the winter is 10% warmer than average, the figure would decline to 22% more. The EIA made similar forecasts for electricity, propane, and oil. These are the coldest places in America today.

At the other end of the spectrum of people who can’t pay energy bills is Minnesota, with the lowest national rate of 11.3% of adults living in households that can’t pay their energy bill. Ironically, it is one of the coldest states in the nation. This is how global warming is affecting every state.

Click here to see the state where people can’t pay their energy bills

The Most Dangerous Volcanoes in the United States

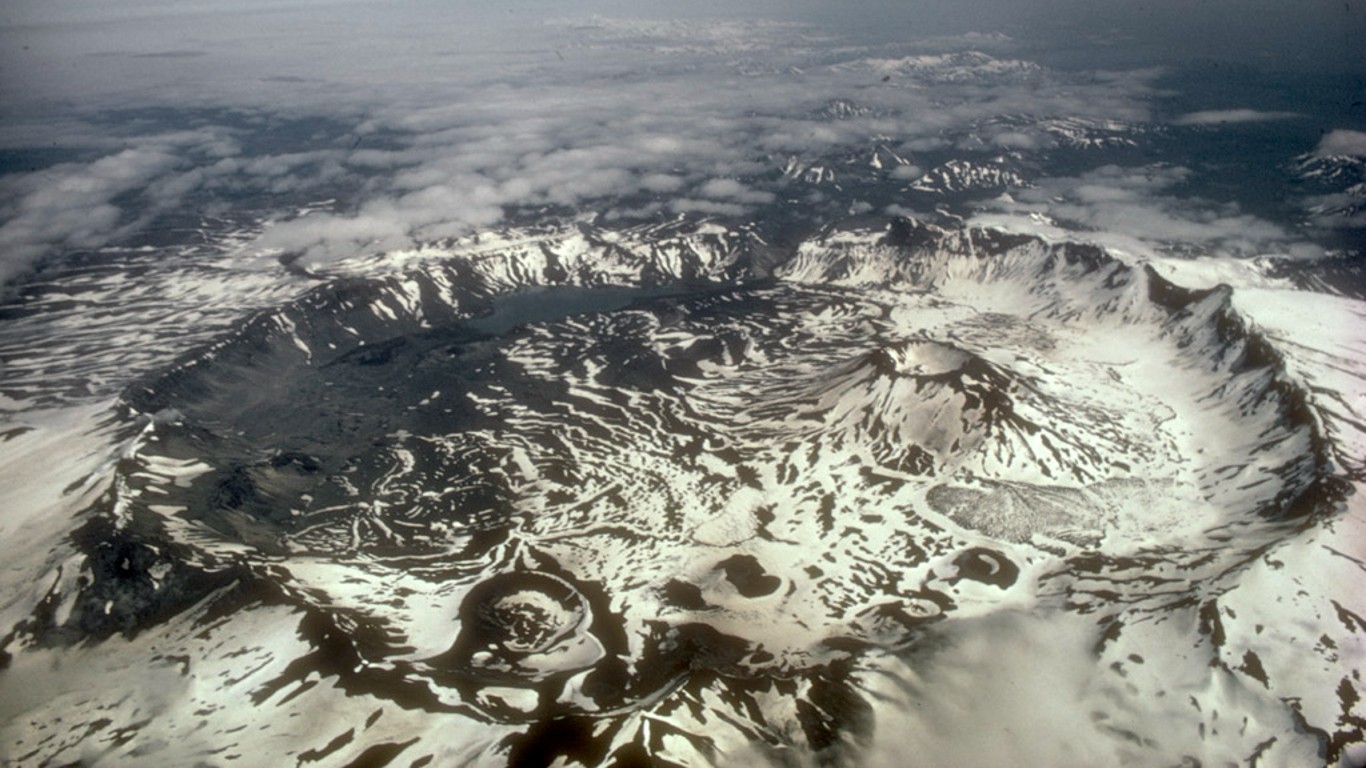
Source: M. Williams, National Park Service / Wikimedia Commons

Volcanic eruptions don’t occur only in faraway lands. The U.S. is dotted with active volcanoes poised to erupt at any minute. The U.S. Geological Survey points out there are 1,350 potentially active volcanoes worldwide, of which 500 have a recorded history of erupting, sending off rivers of lava and plumes of noxious gas. (These are the most dangerous volcanoes on the planet.)

Of the total number, 161 are located in the U.S., mostly along the American portions of the so-called Ring (or Rim) of Fire, a seismically and volcanically active zone stretching along most of the Pacific Rim. That places the majority of the active volcanoes in the country in the Alaskan Aleutian volcanic chain, Hawaii, and California, Oregon, and Washington. 

In fact, Hawaii’s Kīlauea volcano has been spewing lava since 1983. But a major eruption in the spring of this year threw “320,000 Olympic-size swimming pools’ worth of molten rock from its eastern flank,” according to a report in the New York Times. The USGS continues to monitor flow at the volcano.

To identify the most dangerous volcanoes in the United States, 24/7 Wall St. reviewed the overall threat score from the “2018 update to the U.S. Geological Survey national volcanic threat assessment.” The most recent eruption year also came from the USGS. The population within 30 kilometers and 100 kilometers (about 18 and 30 miles, respectively), for each volcano was obtained from The Smithsonian Institution’s “Volcanoes of the World” database

Click here to see the most dangerous volcanoes in America

The USGS ranks volcanoes into five threat categories: very low, low, moderate, high, and very high. The assessments account for the volcano’s eruptive activity and history as well as its geographic location. By that standard, 18 U.S. volcanoes classify as very high threat, with 11 of those located in Washington, Oregon, and California where they loom over large population centers. Alaska is home to five of the 18, owing to their presence near densely populated areas and important economic infrastructure. (See the most devastating volcanic eruptions in history.)

In addition, the USGS assigns each volcano an overall numerical threat score based on some 24 metrics assessing “a volcano’s hazard potential and exposure of people and property to those hazards (independent of any mitigation efforts or actions).” Our list includes only those volcanoes with a score of 100 or more.

This Country Is the Worst Polluter in the World

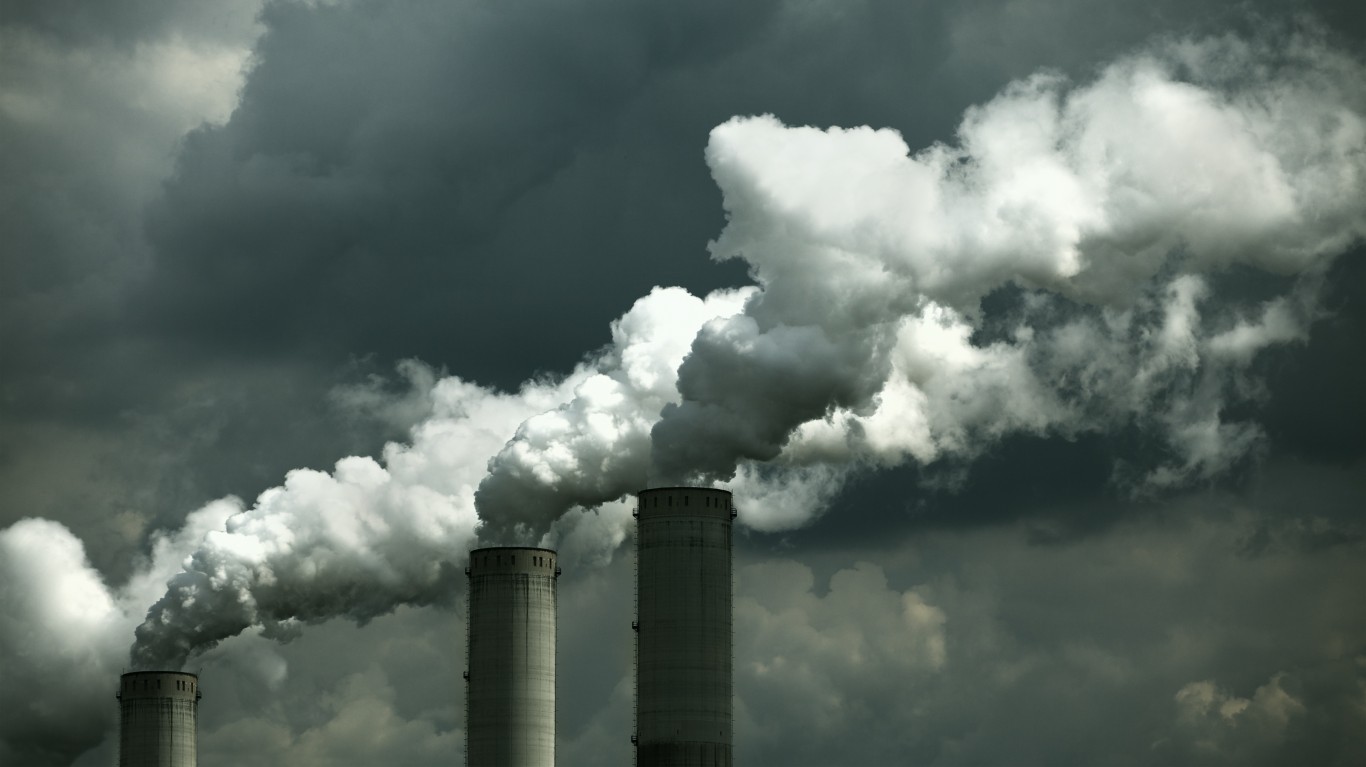
Source: Drbouz / Getty Images

The world’s largest nations are desperately trying to minimize the behaviors that have massive negative effects on the climate and cause global warming. Many of those behaviors contribute to CO2 emissions, and when measured per capita, Qatar is the worst polluter in the world.

Most recently at the United Nations climate summit in Glasgow, the discussion has been about limiting methane and deforestation. The problem of deforestation has become so severe that Prime Minister Boris Johnson of Britain commented, “These great teeming ecosystems — these cathedrals of nature, are the lungs of our planet.”

But deforestation is only one of the topics discussed by world leaders. Another is CO2 emissions. Much of the blame for global warming has been put on several industrial nations, particularly China, the United States, India, Russia, and Japan. 

CO2 emissions can be measured by nation based on total tonnes per year. By this measure, China tops this list, according to comparison service Selectra “with 9.8 million tonnes of CO2 emissions, largely due to the export of consumer goods and its heavy reliance on coal.” The United States is second with 4.9 million tonnes, followed by India at 2.4 million tonnes. (Based on oil and gas company BP’s 2020 Statistical Review of World Energy.)

Another measure may be more telling — tonnes of CO2 per capita. Based on this measure, Qatar ranks the world’s worst polluted with 37.05 tonnes of CO2 per capita, followed by Kuwait at 23.49, and Saudi Arabia at 19.39. (And this city emits the most carbon dioxide in the world.)

Based on proven oil reserves, Saudi Arabia ranks second with 267,026 million barrels. Kuwait ranks sixth at 104,000 million, and Qatar ranks 14th at 25,244 million. On the other hand, Saudi Arabia ranks 41st by population at 34,813,871. Qatar ranks 109th at 2,881,053, and Kuwait ranks 129th at 4,270,571.

While the focus of restrictions centers squarely on the largest polluters by tonnes, the per capita emissions are rarely mentioned. 

The pollution problem is an issue for Saudi Arabia’s own citizens. The International Association of Medical Assistance to Travellers reported that the air quality in Saudi Arabia is considered unsafe, based on the World Health Organization’s guidelines. The recent data indicates that the “annual mean concentration of PM2.5 is 88 µg/m3, exceeding the recommended maximum of 10 µg/m3.” (These are America’s 50 dirtiest cities.)

Click here to see the country that is the worst polluter in the world

The Coldest Town in Every State

Source: Casarsa / Getty Images

With the holidays upon us, winter, with its short days and bitter cold nights, is about to descend on the United States.

Regardless of the region of the country, every state experiences some level of cold in the winter. Even in Hawaii temperatures dip below 40 degrees during the year’s coldest period in the islands’ highest elevations. (Find out if Hawaii is home to any of the most dangerous volcanoes on the planet.)

As winter approaches, 24/7 Wall St. identified America’s 50 coldest cities, using data compiled by the National Oceanic and Atmospheric Administration.

In 45 states, the coldest month of the year is January. December and February are the coldest months in other states. You might recall that February of 2021 was a brutally cold month. During that month, Billings, Montana, and Fargo, North Dakota, persevered through their longest sub-zero stretches since 1983 and 1996, respectively.

The coldest town in all but two states has average low temperature during their coldest month at or below freezing. The states whose towns are the coldest are in the Midwest, the Great Plains, the Mountain states, and New England. Prolonged cold might make you pine for those sweltering days of summer. But you might still want to stay away from the hottest inhabited places on Earth.

It is anybody’s guess as to what this winter will bring. In its annual winter forecast, NOAA’s Climate Prediction Center forecast above-average temperatures in the South and most of the eastern U.S for the second straight winter. Below-average temperatures are predicted for parts of Alaska and the Pacific Northwest.

Click here to see the coldest town in every state

To identify the coldest town in every state, 24/7 Wall St. reviewed average minimum temperature for the years 1991-2020 for U.S. cities with data from the National Oceanic and Atmospheric Administration. NOAA collects temperatures observed by local weather stations.

Additional data points, including average low temperatures during the coldest month in each town and the average number of days when the temperature falls to 32°F or below also come from the NOAA. These averages include all years between 1991-2020 for which data is available.

Census-designated places and township communities were included in addition to towns for certain states where the required data sets were available.

ZEUS: UK charging plan for EVs is a guideline for Biden strategy

Source: nrqemi / Getty Images

By David Callaway, Callaway Climate Insights

(David Callaway is founder and Editor-in-Chief of Callaway Climate Insights. He is the former president of the World Editors Forum, Editor-in-Chief of USA Today and MarketWatch, and CEO of TheStreet Inc.)

NEW YORK (Callaway Climate Insights) — Among the bigger challenges President Joe Biden’s new infrastructure bill faces now that it is law is how to create a national network of charging stations that can keep pace with surging demands for electric vehicles.

Why is this column called ZEUS? David Callaway explains here.

Investors in public charging companies such as Blink Charging (BLNK), Chargepoint Holdings (CHPT) and EVgo (EVGO) should pay attention to what is happening in the UK, where Prime Minister Boris Johnson announced an ambitious new strategy this week.

Already the most advanced country in Europe in terms of EV adoption, with about 250,000 public and private charging stations across the island, the UK plans to add more than a million more in the next 10 years . . . .

To read this column, all our insights, news and in-depth interviews, please subscribe and support our great climate finance journalism.

Callaway Climate Insights Newsletter

Latin America counts few COP26 wins; plus, Brazil hides bad forest results

By David Callaway, Callaway Climate Insights

(About the author: Michael Molinski is an economist, content strategist and author. He has worked for Fidelity, Charles Schwab and Wells Fargo, and previously as a foreign correspondent and editor for Bloomberg News and MarketWatch. He is the author of Investing in Latin America: Best Stocks, Best Funds (Bloomberg Press, 1999), and Small Business in Paradise (Nolo, 2007). Currently, he is a senior economist at Trendline Economics.)

PLAYA DEL REY (Callaway Climate Insights) — The failure to reach an agreement on carbon reduction at the COP26 summit was clearly a disappointment. But more importantly to Latin America was the lack of commitments by the developed world to increase funding for environmental projects or to establish green funds which Latin America and other poorer regions need desperately to fight the ravages of climate change.

The presidents of Colombia, Ecuador, Bolivia, Argentina, Costa Rica and Honduras all attended COP26. Those who publicly said they would not attend are the two presidents from the most powerful and populous countries, Brazil and Mexico.

Some successes on climate change from Latin America

There were some new commitments from Latin America, most notably from Colombia, which said it will increase its pledge to the UN . . . .

To read this column, all our insights, news and in-depth interviews, please subscribe and support our great climate finance journalism.

Callaway Climate Insights Newsletter

The two words at COP26 that didn’t cause convulsions; plus, Bill Gates goes nuclear

Source: erniedecker / iStock via Getty Images

By David Callaway, Callaway Climate Insights

Jonathan Maxwell was thrilled with two words that appeared in the COP26 final draft this past week and they weren’t “phased down” or “phased out” — which dramatically split China and India from the rest of the world at the 11th hour. Instead, they were two words that had never appeared in a COP communique before: energy efficiency.

Maxwell, the founder and CEO of Sustainable Development Capital LLC, which runs the only publicly traded investment trust in the UK (LSE:SEIY) dedicated to sustainable finance, said after attending COP summits since 2009, that it was great to see energy efficiency given some priority in global decarbonization plans.

“It is only 40% of the solution, after all,” he joked. Maxwell said the inclusion topped off an “inspiring” COP26 in Glasgow, in which he witnessed climate finance come to the fore. During the conference, he said he saw total assets under management at his company pass $2 billion for the first time and just before it started SDCL announced formation of a special purpose acquisition company (SPAC).

SDCL Edge Acquisition raised $175 million and started trading on the New York Stock Exchange this week, under the ticker SEDA.UT. Maxwell said the company will use the money to take a private company public in the next 24 months. He said it would be a company in the U.S., where SDCL has half its assets, or Europe, and would likely be tied to energy efficiency.

Callaway Climate Insights profiled Maxwell and SDCL last year. As energy efficiency — the practice of helping new and existing buildings reduce energy waste — becomes a bigger part of climate solutions, we can expect more investment, and investment deals to come from that sector. Including this one from SDCL Edge.

Maxwell said for the first time in all the years he’s attended the Conference of Parties (COP) on climate change, the discussion has started to move from the “why” to the “when” to the “how.” In his mind at least, that goes to energy efficiency.

Editor’s note: Callaway Climate Insights will not publish next Tuesday and Thursday for free readers because of the Thanksgiving holiday in the U.S. Subscriber posts will go out as usual per the news cycle.

More insights below. . . .

ZEUS: Infrastructure pop on Wall Street strains chances for Build Back Better

. . . . Stocks ranging from electric vehicles and charging station companies to building construction firms popped this week after President Joe Biden signed the infrastructure bill. But the “Build Back Better” bill now before Congress has more than three times the spending for climate change than infrastructure did. At a time when inflation and supply chain issues are roiling economies, will this one be as easy as the Democrats say it might be? David Callaway has the analysis and what’s next. . . .

Read the full ZEUS column

Banks, business and bypassing Bolsonaro in Brazil

. . . . With all due respect to Greta Thunberg, the answer to saving the Amazon Basin from environmental destruction may come down to the banks and businesses that are coming together to oppose the politics of cattle ranching and forest clearing, writes Ilona Szabo, co-founder and president of the Igarapé Institute, along with Julia Sekula and Ricardo Amatucci. In a guest piece from Glasgow, the writers point to a growing opposition to the policies of President Jair Bolsonaro inside Brazil, particularly among the blue-chip banks behind a lot of the economy. Is it time for a Brazilian reset? . . .

Read the full column

Thursday’s subscriber insights: Bill Gates goes nuclear; ICE expands its carbon credits business

. . . . Bill Gates, who famously said climate innovation will produce eight to 10 Teslas, a Google, an Amazon and a Microsoft, is putting his money into nuclear energy. A new company he’s founded called TerraPower aims to put a unique type of nuclear reactor in Southwest Wyoming, using liquid sodium instead of water. Nuclear power is controversial in clean energy circles, but this project has drawn some big players, including Warren Buffett and the U.S. Energy Department. Read more here. . . .

. . . . It’s hard to miss all those new electric bikes buzzing down our roads, especially in big cities. But with the advent of the e-bike age now comes the problem of how to recycle the batteries, millions of them. A Boulder, Colo. company thinks it has the answer. Read more here. . . .

. . . . The Intercontinental Exchange is expanding its carbon credits business, with a deal to offer carbon credit auctions on projects run by Permian Global, the UK-based developer of tropical forest protection and restoration strategies. ICE, the leading exchange in offering carbon trading in European, UK and U.S. carbon offsets, announced the deal just days after negotiators agreed on rules for international carbon trading at COP26 in Glasgow. . . .

. . . . The National Hockey League may be on thin ice with its recently announced partnership — under, ironically, its NHL Green program — with Chemours (CC), a spinoff of chemical giant DuPont (DD). The dilemma is over a substance called Opteon, a refrigerant mix used in the creation of ice at skating rinks. Read more about the debate over how green this deal really is. . . .

. . . . The EPA plans to begin restricting the use of super-polluting hydrofluorocarbons (HFCs) as coolants in air conditioners, as well as in refrigerators, heat pumps, insulation and aerosols. These changes could benefit U.S. companies if they take advantage of the opportunity to build better and less-polluting cooling technology, beating out the competition, especially in Asia. Read more here. . . .

Was COP26 a success, a failure or a crying shame? In Europe, depends who you ask

. . . . EU President Ursula von der Leyen said it was a “step in the right direction.” Bas Eickhout, vice-chair of the Greens/European Free Alliance, said it was not a success. COP26 President Alok Sharma of the UK held back tears at the end as two big polluters tried to torpedo a coal deal. After 13 days of drama and geopolitical intrigue, the United Nations climate summit is over, and delegates have returned to their countries. Daniel Byrne in Dublin puts the pieces back together. . . .

Read the full EU notebook

Editor’s picks: U.S. holds big crude sale in Gulf; armadillos march north

U.S. holds big crude sale in Gulf

Vast oil reserves in the Gulf of Mexico, holding an estimated 1.1 billion barrels of crude, were auctioned Wednesday by the U.S. Interior Department. Companies including Shell (RDS.A), BP (BP), Chevron (CVX) and ExxonMobil (XOM) bid a combined $192 million for drilling rights on federal oil and gas reserves in the Gulf of Mexico. The Associated Press reports it’s the first such sale under the Biden administration. Bids were expected on drilling leases across 136,000 square miles — about twice the area of Florida. The AP notes it will take years to develop the leases before companies start pumping crude, “meaning they could keep producing long past 2030, when scientists say the world needs to be well on the way to cutting greenhouse gas emissions to avoid catastrophic climate change.”

The town besieged by armadillos

Blame climate change. Armadillos, Texas’s state mammal, is common in that state’s dry heat. But they’ve moved into the town of Sapphire, N.C. — 800 miles away in the Blue Ridge Mountains. The Guardian reports on why this creature, native to southern America, is marching north and how Jason Bullard has become a sort of bounty hunter in the region. According to The Guardian report, “When the first armadillo was sighted here in 2019, Bullard got a call. ‘I just didn’t believe it,’ he said. ‘I thought the woman had a possum and a drinking problem.’ But within a year, Bullard was spending his nights at the local golf course, speeding from hole to hole on a golf cart, killing armadillos on the greens like a sort of cross between Tiger Woods and Davy Crockett.”

Words to live by . . . .

“We are, after all, the greatest problem solvers to have ever existed on Earth. If working apart, we are a force powerful enough to destabilize our planet. Surely working together, we are powerful enough to save it.” — David Attenborough.

Callaway Climate Insights Newsletter

The Most Powerful Hurricane of All Time

Source: Chip Somodevilla / Getty Images

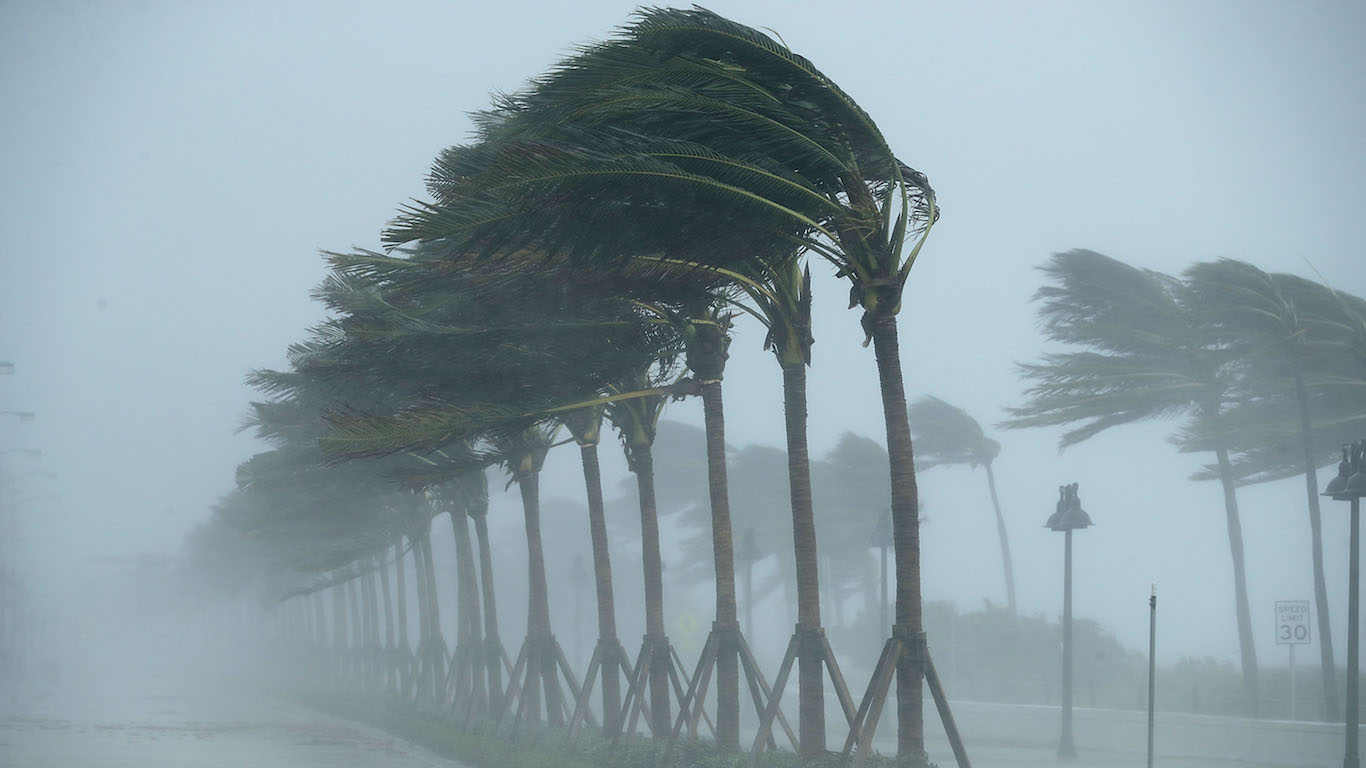
Hurricane Ida hit the United States earlier this year as a Category 4 storm. Some estimates are that it was the second most powerful hurricane to hit the country in recorded history. Ida formed on August 21 and did not dissipate until September 4. In that time, it devastated Louisiana and other parts of the Gulf Coast, and then it moved to the mid-Atlantic and up the coast to New England. It set off tornados in Pennsylvania and caused the day in New York City with the most rain ever. Despite all of this, Ida was not the most powerful hurricane of all time. One of the most powerful storms hit Galveston in 1900 and killed over 6,000 people.

To determine the most powerful hurricane of all time, 24/7 Wall St. used data from the National Oceanic and Atmospheric Administration (NOAA) dating back to 1851 to rank tropical cyclones based on estimated central pressure at the time of landfall for all hurricanes. Hurricanes were ranked according to their minimum pressure. The lower a storm’s minimum pressure, the stronger the storm is.

The frequency of tropical cyclones in a given year is rarely an indication of how intense the hurricanes may be when they make landfall; that is, how destructive they can be. Some of the most powerful storms, like Hurricane Andrew in 1992, for example, hit during one of the slower hurricane seasons of the past several decades. The strength of a hurricane is difficult to accurately predict, and the most intense storms on record vary heavily by decade, deadliness and destructiveness.
[nativounit]
The most powerful hurricane of all time was the “Labor Day Storm” in September 1935. Here are the details:

  • Minimum pressure millibars: 892
  • Maximum wind speed at landfall: 160 mph
  • Maximum wind speed measured: 160 mph
  • Affected area: Andros Island, Florida Keys

The most intense hurricanes as measured by minimum central pressure are not necessarily the deadliest or costliest storms. In most cases, the amount of damage caused by a hurricane does not only depend on its intensity but also on the amount and value of property at risk in the storm’s path. Much of the damage caused by the costliest hurricanes was caused by inland flooding triggered by torrential rain. Many of the deadliest and most expensive hurricanes made landfall in states along the Gulf Coast, where the infrastructure and economies of major cities are based on proximity to oceans and rivers.

Many of the largest hurricane death tolls resulted from storm surges that caused the ocean level to rise 10 feet or higher. In the Great Galveston Hurricane in 1900, the deadliest tropical cyclone in U.S. history, a storm surge covered all of Galveston Island off the Texas Gulf Coast in 8 to 12 feet of water, destroying nearly all buildings in the vicinity and leading to the deaths of possibly 8,000 people by drowning or being crushed by debris.

While hurricanes may be growing more intense and frequent, disaster preparedness also is becoming more effective. Hurricane forecasting has advanced considerably over the past century and advanced warning has helped minimize the deadliness of many of the most powerful storms of the past several decades. Excluding 2005 (the year Hurricane Katrina directly killed about 1,200 people), the 10 years with the highest hurricane-caused death counts are all before 1960. Excluding Katrina, NOAA has reported 1,300 deaths caused by hurricanes since 1960, compared with 14,645 deaths reported between 1900 and 1960.

While hurricanes are becoming less deadly as damage mitigation strategies and disaster preparedness improve, they are also becoming more destructive. The 10 costliest hurricanes have all occurred since 1992. This may be in part because of the increased amount of property at risk today in comparison with previous decades. Adjusted for inflation, the costliest hurricanes in U.S. history were Hurricane Katrina (2005), Hurricanes Harvey and Irma (2017), Hurricane Andrew (1992) and Hurricane Ike (2008).

Tropical cyclone activity in the Atlantic Ocean often peaks in the late summer, when the temperature differences between the wind and sea surface are the greatest. Of the 70 most intense hurricanes since 1851, 63 occurred in August, September or October.

Methodology: To identify the most powerful hurricane, 24/7 Wall St. reviewed NOAA’s hurricane database (HURDAT 2), which tracks the date, time, location, minimum pressure (in millibars) and wind data for hurricane episodes from 1851 to 2019. Hurricanes were ranked according to their minimum pressure in millibars, where one millibar is the equivalent of 100 pascals in pressure. The lower a storm’s minimum pressure, the stronger the storm is. For context, air pressure is 1,013 millibars at sea level.

Click here to see all the most powerful hurricanes of all time.
[wallst_email_signup]

American Cities With the Most Unusually Warm Temperatures This Year

Source: Tomwang112 / Getty Images

The United Nations Climate Change Conference, also known as COP26, ended Nov. 12 in Glasgow, Scotland, with significant differences among nations on how to keep global temperatures from rising more than 1.5 degrees Celsius (34.7 degrees Fahrenheit) above pre-industrial levels and how to compensate poorer nations for the climate havoc inflicted on them by rich nations.

While people argue over global warming — including many who still deny human activity has anything to do with it — and what to do about it, temperatures keep climbing. (This city emits the most carbon dioxide in the world.)

The global average temperature has risen by 0.14 degrees Fahrenheit per decade since 1880, but the rate of warming over the past 40 years has been more than double that, at 0.32 degrees, according to the U.S. National Oceanic and Atmospheric Administration. The 10 warmest years on record have occurred since 2005, and there’s no end in sight. (These are 25 cities where rising seas could leave millions homeless.)

Rising temperatures have a significant incremental impact on local weather and the environment. They significantly alter weather patterns, causing more severe and frequent storms, and increase the frequency of droughts. The knock-on effects include a greater range of infectious diseases that thrive in warmer climates.

In the U.S., the effects of rising temperatures are already causing intense flooding in urban and suburban areas of the Northeast, insect outbreaks and tree diseases in the Northwest, damages to energy and agricultural infrastructure in the Southeast, extreme heat and flooding across the Midwest, and seasonal wildfires across the West. 

To determine the 25 U.S. cities with the most unusually warm temperatures this year, 24/7 Tempo reviewed data on average temperatures in September from the National Centers for Environmental Information of the NOAA. Cities were ranked based on the highest difference in the average temperature in September 2021 from the historical average temperature for September from 1901 to 2000. Data on the hottest and coldest September months on record also came from the NCEI, with records dating back to 1895. Data for cities in Hawaii was not available.

This list of U.S. cities that had far hotter temperatures in September than their historical average are mostly inland and in the northern and central parts of the contiguous 48 states. Among the 25 cities, North Dakota has five, while Kansas and Nevada are home to three, including Las Vegas. The only cities on this list outside this region are Montpelier, Vermont, and Lubbock, Texas. 

Temperatures in the cities on the list were at least 5.2 degrees above their respective historical averages in September. In the hottest city, they were 7.8 degrees above historical average. 

Click here to see the U.S. cities with the most unusually warm temperatures this year

Fastest-Growing (and Shrinking) Clean Energy Jobs

Source: 4FR / E+ via Getty Images

Clean energy is a growth industry, and increasingly so, but the COVID-19 pandemic year of 2020 saw the clean energy workforce shrink by 3.73% from the previous year, according to preliminary data from the 2021 U.S. Energy Employment Report, as analyzed by E2, a nonpartisan group that advocates for environmental and economic policies. The gain of 188,775 clean energy jobs between 2017 and 2019 was wiped out — and then some — as 306,816 were lost in 2020. 

The largest sector by employment, energy efficiency — the sector employs about two-thirds of the clean energy workforce — suffered significant job losses in 2020, losing nearly 272,000 jobs, despite a recovery in the second half of the year. This was mainly attributed to restricted access to buildings for purposes of installations during the pandemic. 

The renewable energy and clean fuel sectors also saw significant job growth in the second half of 2020, though job growth was still negative by the end of the year when compared to 2017. 

Not all sectors suffered equally, and some actually did very well, continuing or expanding growth even through the pandemic — these sectors are providing the fastest growing energy jobs. Though clean vehicle jobs fell by 18.6% in the first months of 2020, they grew 26.2% in the second half, recording a 17.7% growth from 2017 through 2020. The grid and storage sector also managed to erase pandemic declines and post job growth from 2017.

Job changes by subsector were even more nuanced, though they generally reflected the sector overall. To find the fastest growing clean energy jobs, 24/7 Wall St. reviewed E2’s Clean Jobs America 2021 report. The 21 subsectors are ranked by job growth in the three years from 2017 through 2020. (And these are the states adding the most clean energy jobs.)

Despite the time, momentum, and employment opportunities lost due to COVID-19, the future of clean energy and clean energy jobs is extremely bright, and, for most sectors, the growth in recent years other than 2020 is an indicator of what is to come. (Find if any of the clean energy jobs are among the highest paying jobs you can get without a college degree.)

The level of growth will necessarily depend on the policies the federal government is able to enact in the coming years. Strong clean energy policies that include funding and other incentives will serve to create jobs in every state, offer savings to consumers based on energy efficiency, improve and protect the electric grid, reduce pollution, and play a needed role in the reduction of greenhouse gases that are driving climate change.

Click here to see fastest-growing (and shrinking) clean energy jobs
Click here to see our detailed methodology

Popular Posts