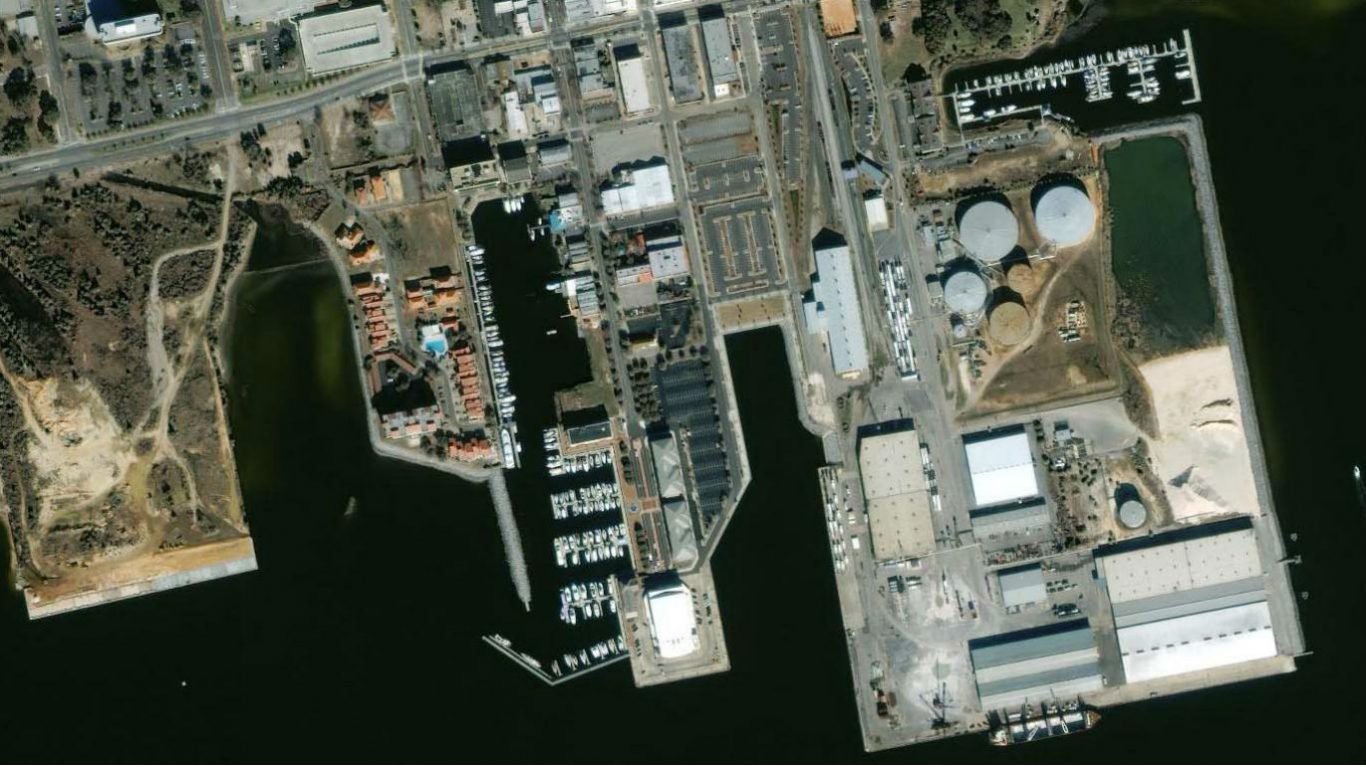
Before
After
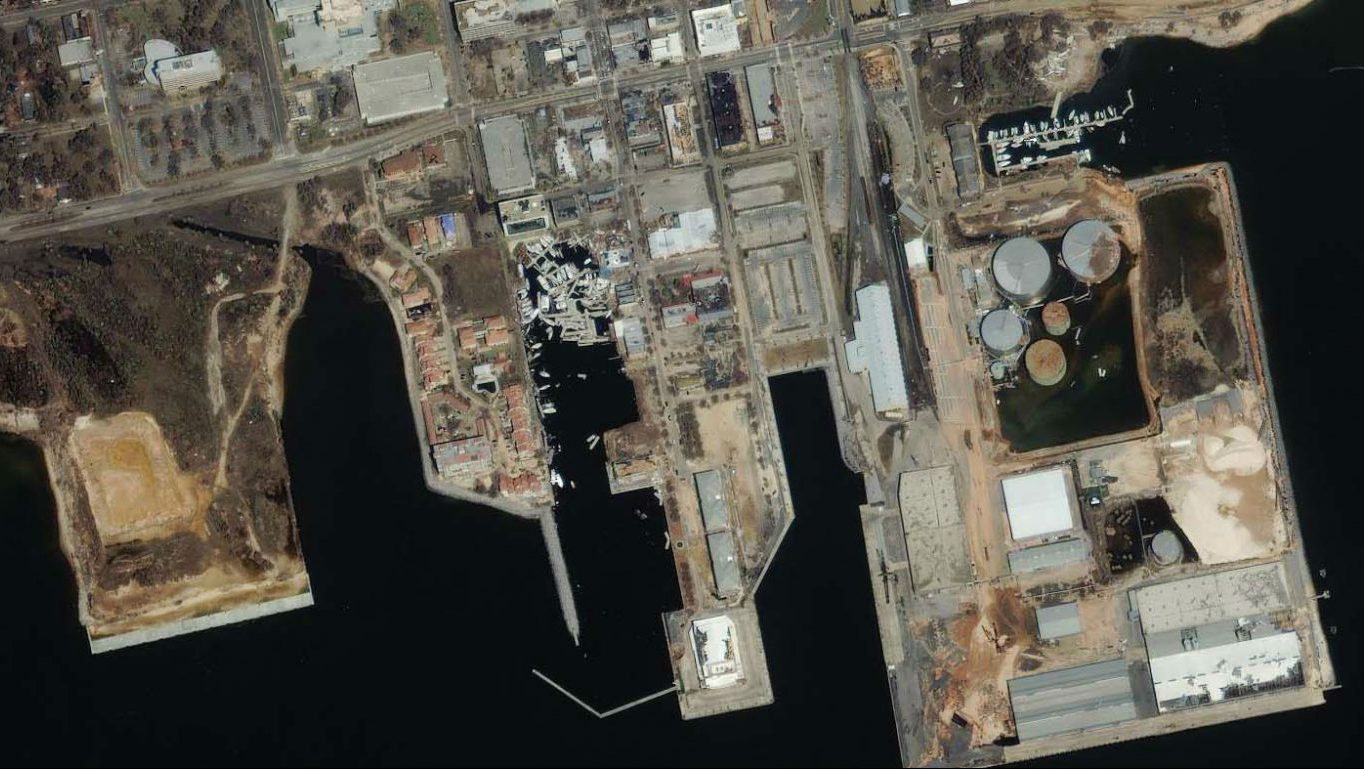
5. Ivan
> Damage: $27.06 billion
> Area pictured: Pensacola, Florida
> Max wind speed at landfall: 105 mph
> Date of landfall: September 2004

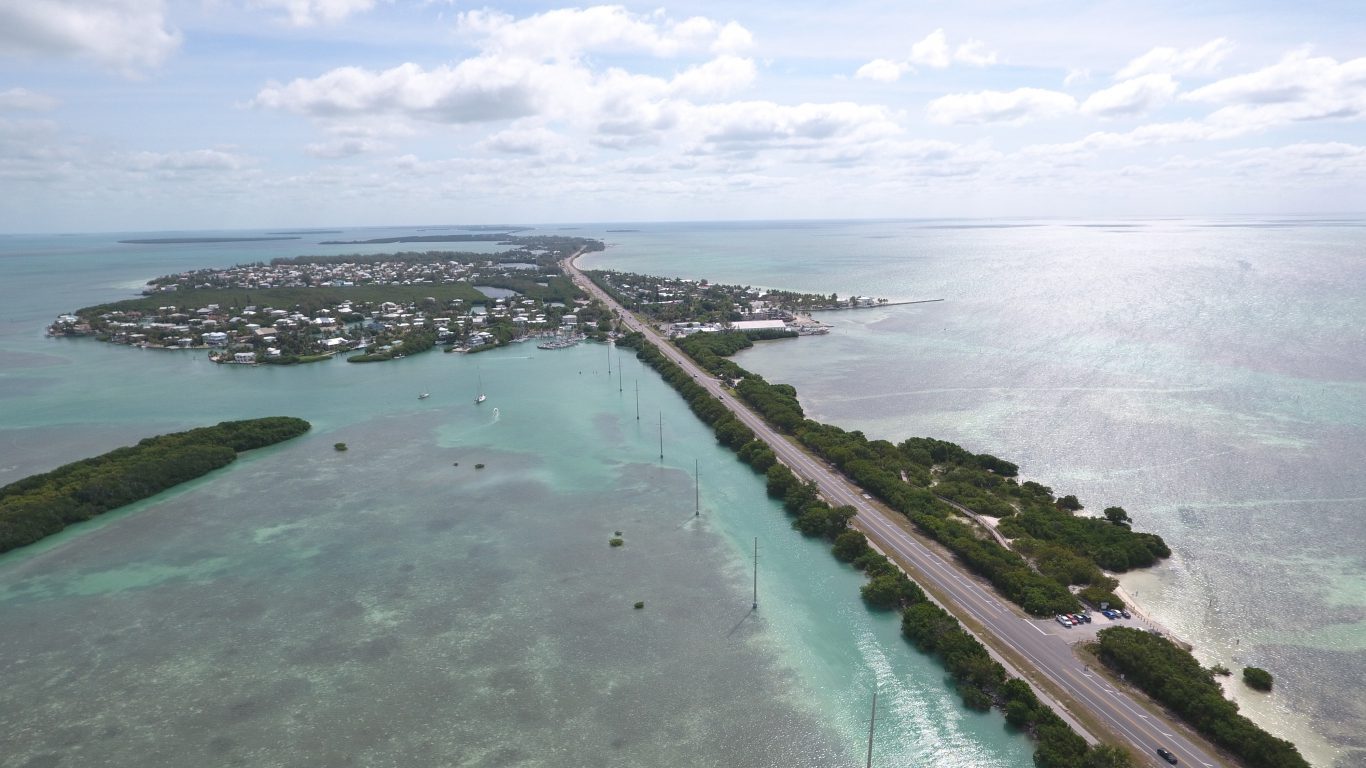
Before
After
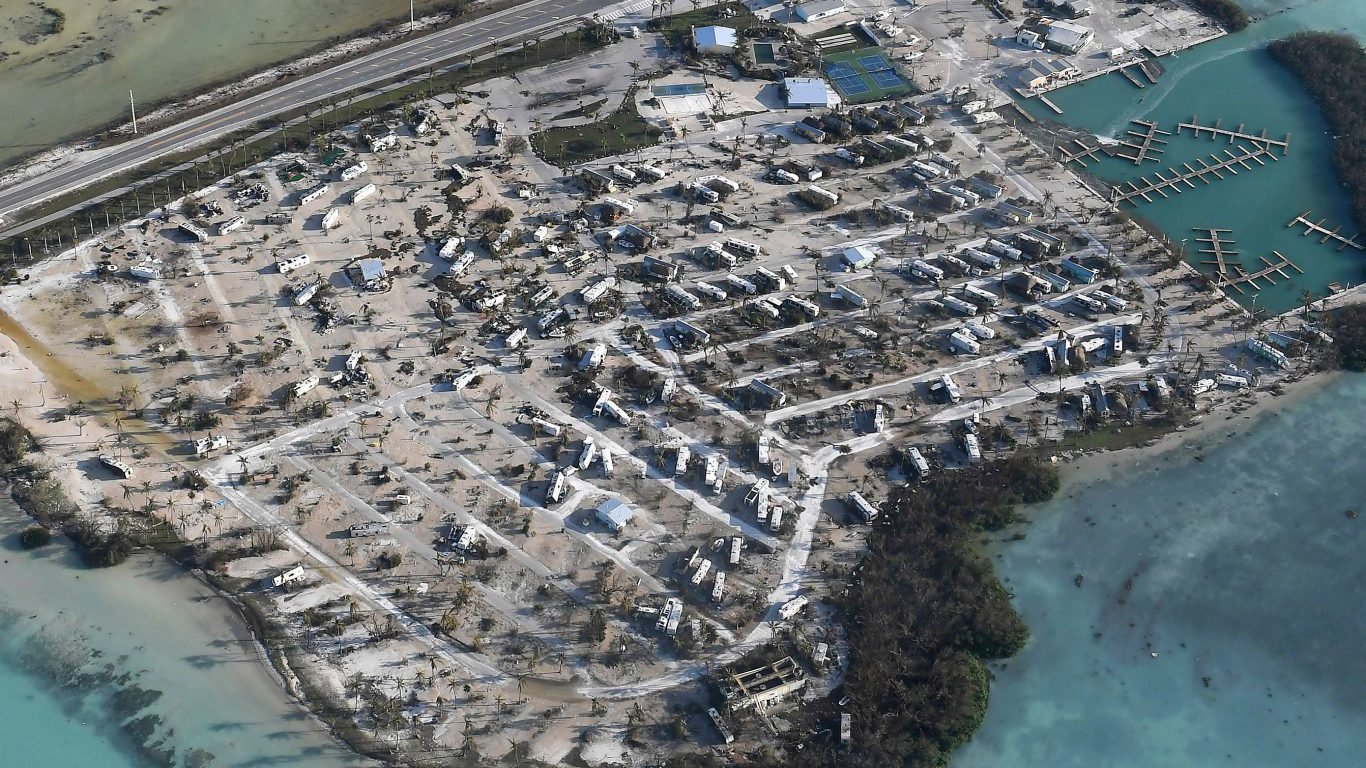
4. Irma
> Damage: $50.00 billion
> Area pictured: Florida Keys
> Max wind speed at landfall: 155 mph
> Date of landfall: September 2017
Before

After
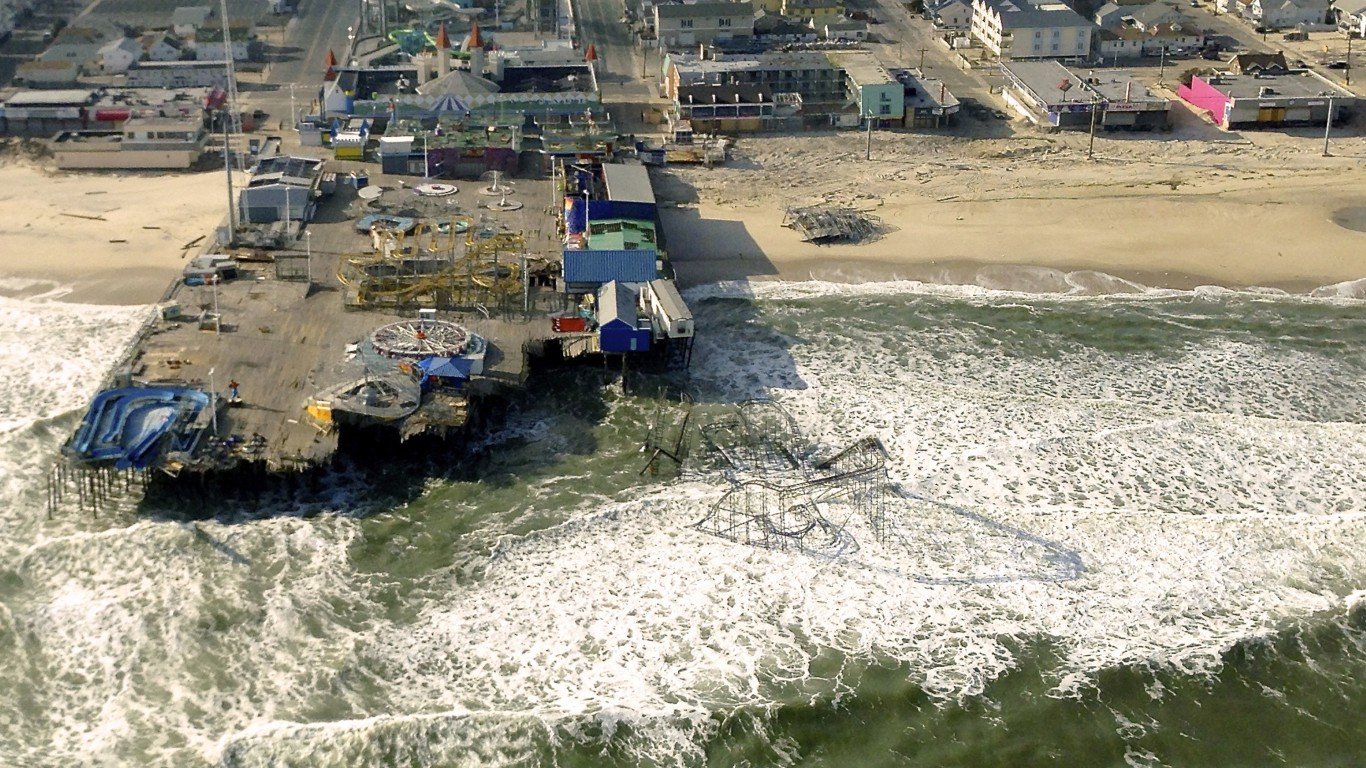
3. Sandy
> Damage: $70.20 billion
> Area pictured: Seaside Heights, New Jersey
> Max wind speed at landfall: 100 mph
> Date of landfall: October 2012
Before

After
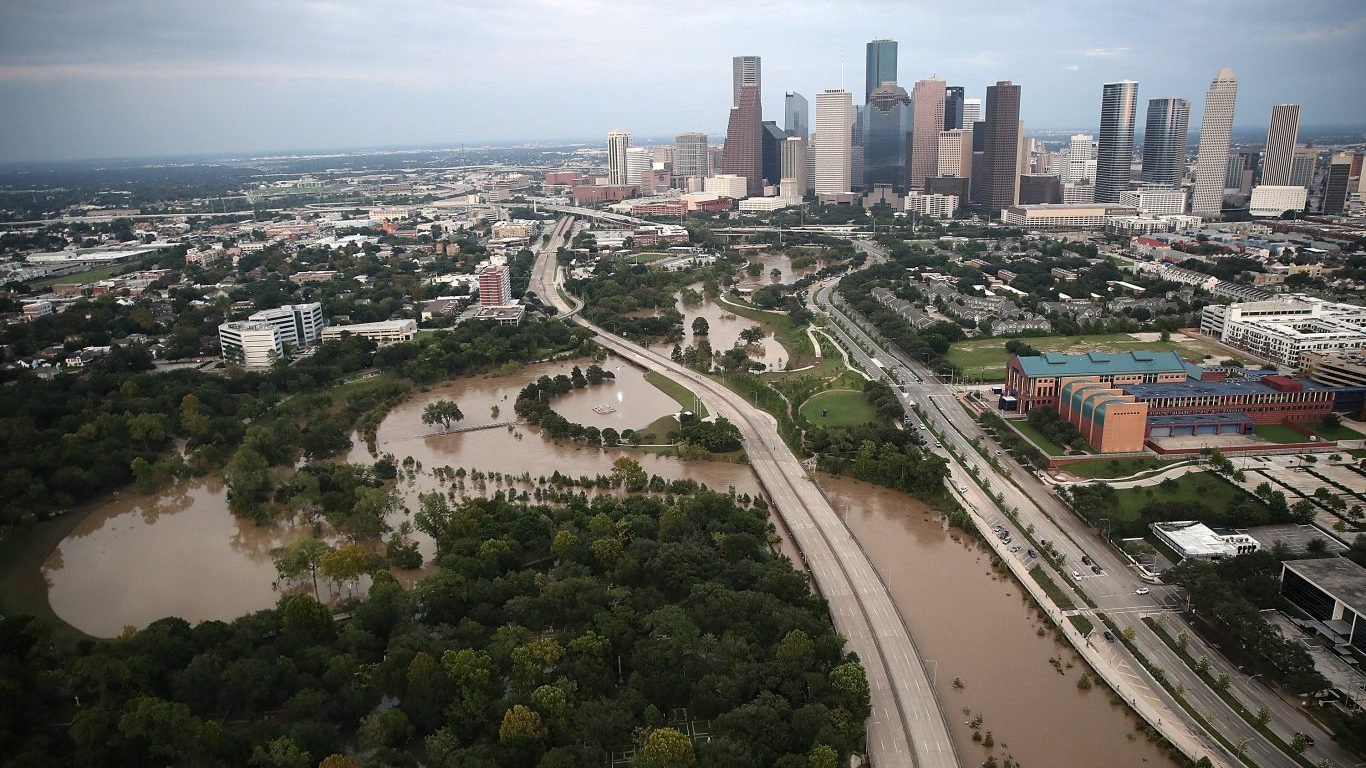
2. Harvey
> Damage: $125.00 billion
> Area pictured: Houston, Texas
> Max wind speed at landfall: 115 mph
> Date of landfall: August 2017
 24/7 Tempo
Before

After
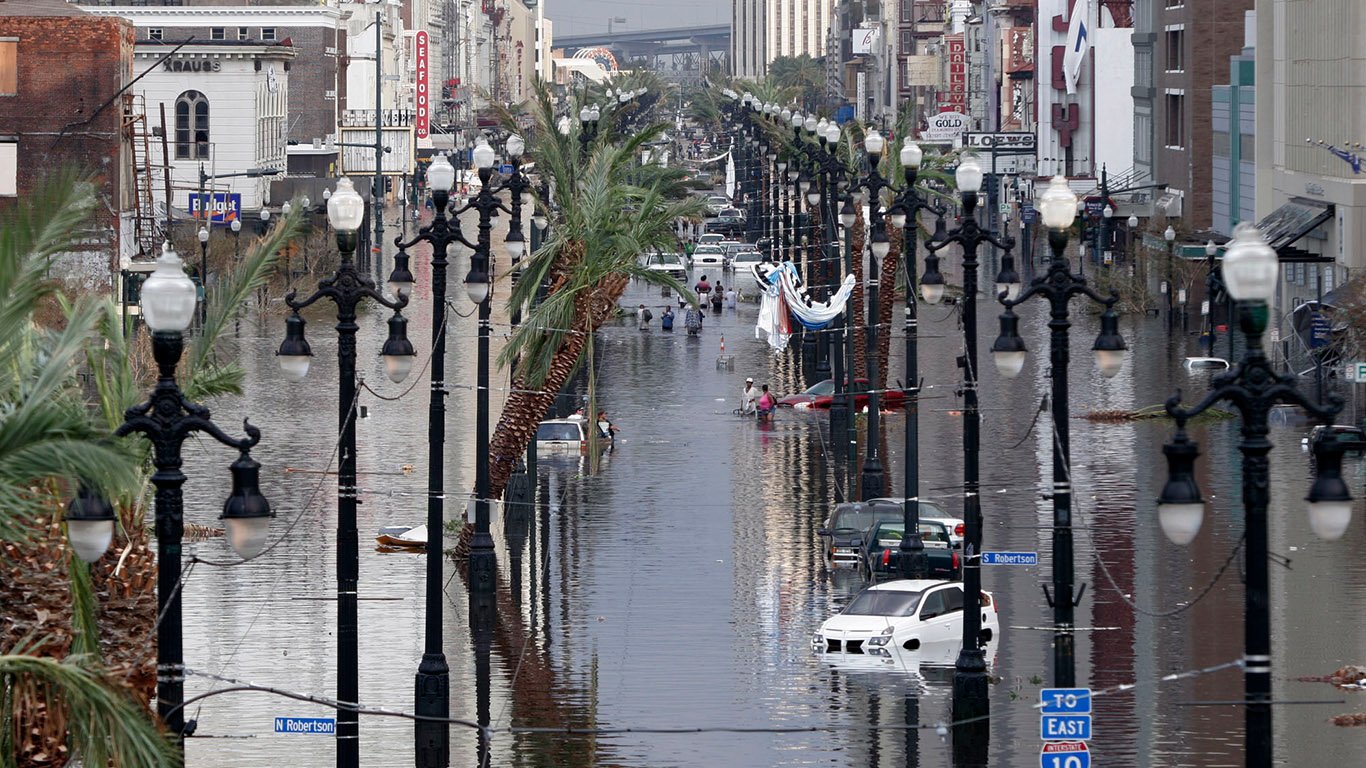
1. Katrina
> Damage: $160.00 billion
> Area pictured: New Orleans, Louisiana
> Max wind speed at landfall: 110 mph
> Date of landfall: August 2005


