25. Equatorial Guinea
> Total CO2 emissions change 2010-2020: 50.87%
> Total CO2 emissions change 1971-2020: 15,464.76% — #1 largest increase of 145 countries
> Total CO2 emissions 2020 in million tons: 10.27 — #104 largest of 145 countries
> CO2 emissions per capita change 2010-2019: -57.90% — #2 largest decline of 144 countries
> Total GHG emissions change 2010-2019: -33.45% — #7 largest decline of 88 countries
A former Spanish colony on Africa’s Atlantic coast, Equatorial Guinea has become one of the sub-Sahara’s largest oil producers since oil was discovered there in 1995. The nation saw the biggest increase in total CO2 emissions from 1971 to 2020, more than 15,000%. Recent data is
more favorable: Equatorial Guinea had the world’s second-largest decline in CO2 emissions per capita from 2010 to 2019, at 57.90%.

24. Pakistan
> Total CO2 emissions change 2010-2020: 52.29%
> Total CO2 emissions change 1971-2020: 1,107.54% — #14 largest increase of 145 countries
> Total CO2 emissions 2020 in million tons: 234.93 — #26 largest of 145 countries
> CO2 emissions per capita change 2010-2019: 11.94% — #51 largest increase of 144 countries
> Total GHG emissions change 2010-2019: 31.55% — #27 largest increase of 88 countries
Pakistan’s accelerating and unplanned urbanization is causing a significant increase in greenhouse gases, threatening to melt the glaciers in the northern part of the country. The Pakistan Journal of Meteorology reported in 2017 that the nation’s greenhouse-gas emissions were rising at an annual rate of 6%.

23. Senegal
> Total CO2 emissions change 2010-2020: 52.30%
> Total CO2 emissions change 1971-2020: 673.57% — #32 largest increase of 145 countries
> Total CO2 emissions 2020 in million tons: 10.46 — #103 largest of 145 countries
> CO2 emissions per capita change 2010-2019: 21.35% — #38 largest increase of 144 countries
> Total GHG emissions change 2010-2019: 51.03% — #16 largest increase of 88 countries
The majority of Senegal’s greenhouse-gas emissions are from its agricultural sector. In recent years, the country’s CO2 emissions per capita fluctuated substantially, but the overall trend has been increasing during the 1971-2020 period, with 0.58 tons of CO2 per capita in 2020.

22. United Republic of Tanzania
> Total CO2 emissions change 2010-2020: 57.92%
> Total CO2 emissions change 1971-2020: 344.39% — #54 largest increase of 145 countries
> Total CO2 emissions 2020 in million tons: 10.95 — #99 largest of 145 countries
> CO2 emissions per capita change 2010-2019: 36.03% — #25 largest increase of 144 countries
> Total GHG emissions change 2010-2019: 47.06% — #18 largest increase of 88 countries
Tanzania’s energy emissions climbed 171% from 1990 to 2014. Much of its greenhouse-gas emissions are from deforestation due to such factors as forest and bush fires. The population depends on wood and charcoal for energy.

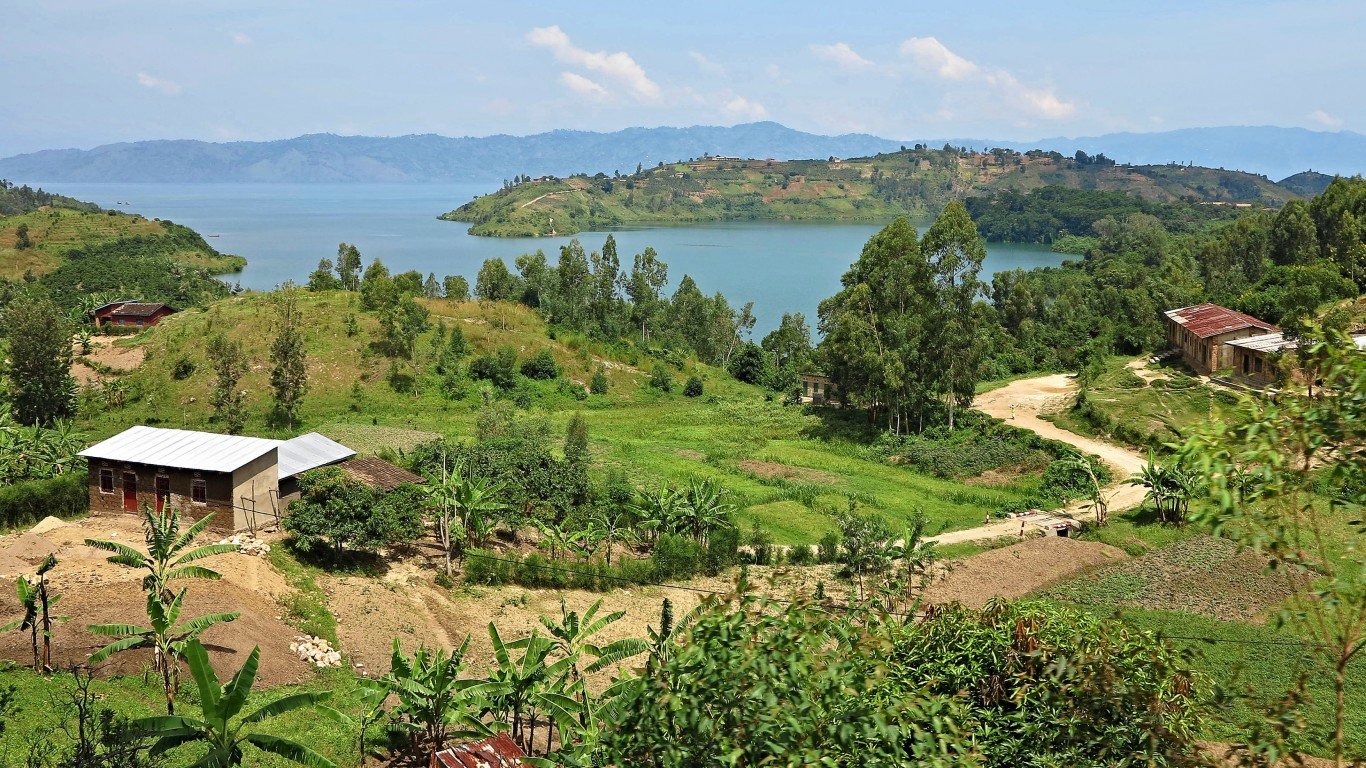
20. Democratic Republic of Congo
> Total CO2 emissions change 2010-2020: 58.87%
> Total CO2 emissions change 1971-2020: 354.89% — #52 largest increase of 145 countries
> Total CO2 emissions 2020 in million tons: 3.12 — #134 largest of 145 countries
> CO2 emissions per capita change 2010-2019: -13.79% — #35 largest decline of 144 countries
> Total GHG emissions change 2010-2019: 0.80% — #57 largest increase of 88 countries
The Democratic Republic of Congo faces a quandary. The west-central African nation has some of the world’s largest reserves of peat, which is dried and burned for fuel. This energy source would help boost the nation’s economy. However, peat emits a lot of carbon, and it is estimated that conversion of peatland into farm use over the centuries has sent more than 250 billion tons of CO2 into the atmosphere.

 24/7 Tempo


