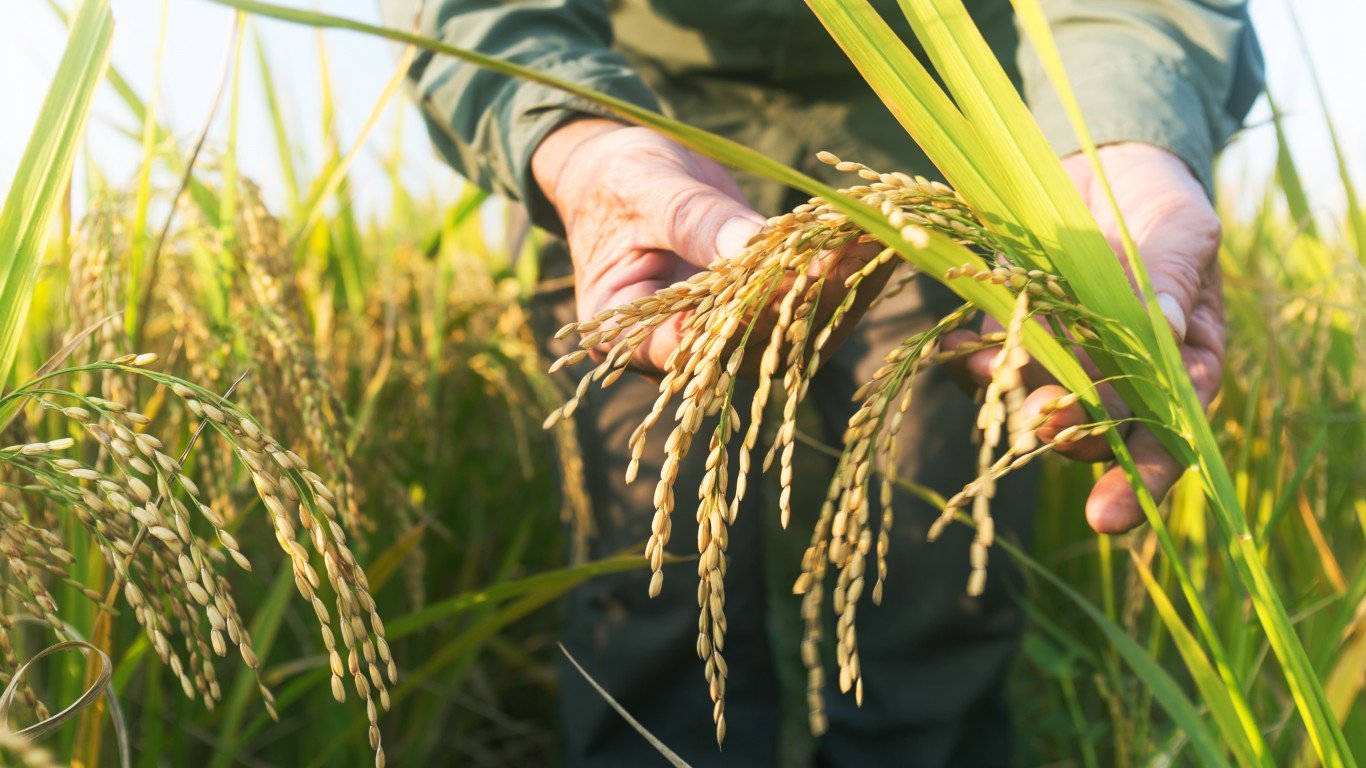
15. Rice
> GHG emissions in kg of CO2 equivalents per 1 kg of food: 4.5
> GHG emissions in kg of CO2 equivalents per nutritional unit: 1.2 per 1000 kcal (20th lowest)
> Land use in sq meters per 1 kg of food: 2.8 (20th lowest)
> Freshwater withdrawal in liters per 1 kg of food: 2,248.4 (6th highest)

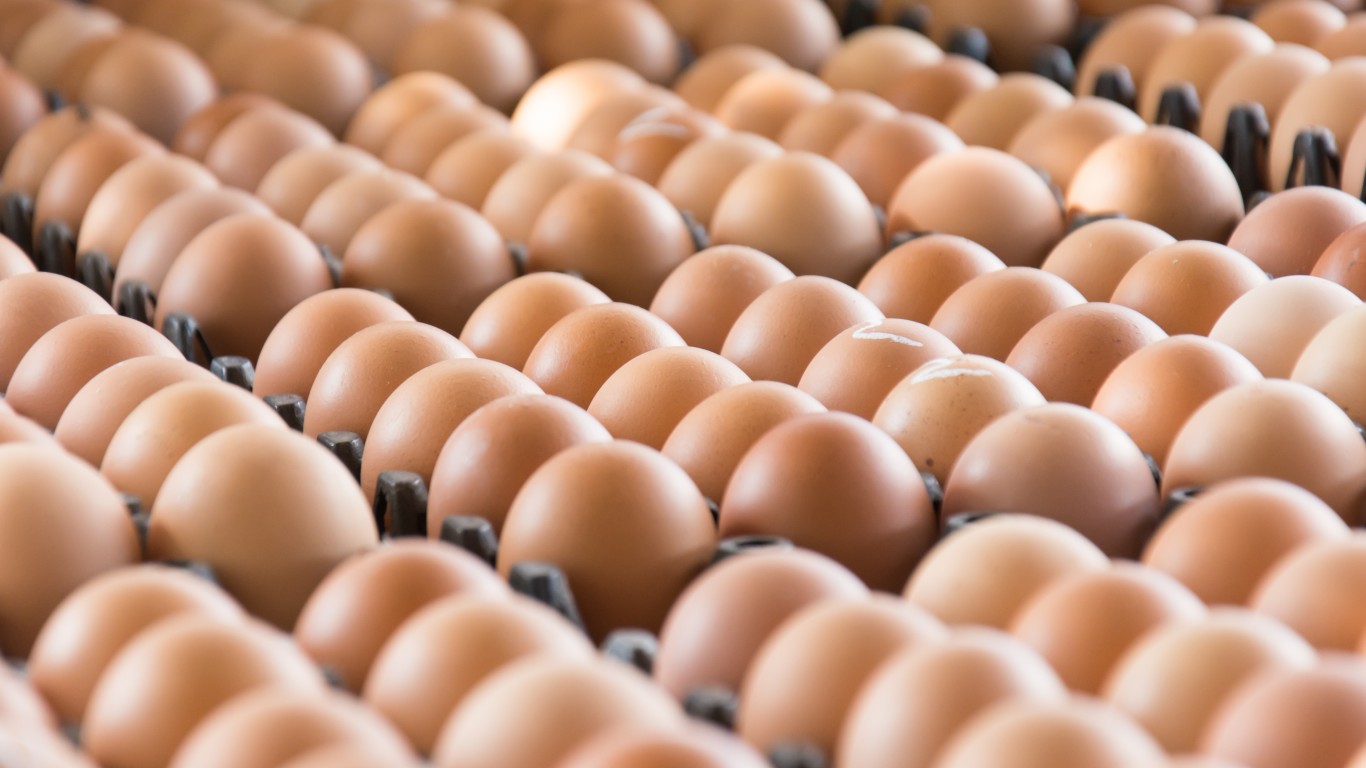
14. Eggs
> GHG emissions in kg of CO2 equivalents per 1 kg of food: 4.7
> GHG emissions in kg of CO2 equivalents per nutritional unit: 4.2 per 100 g protein (12th highest)
> Land use in sq meters per 1 kg of food: 6.3 (20th highest)
> Freshwater withdrawal in liters per 1 kg of food: 577.7 (17th highest)
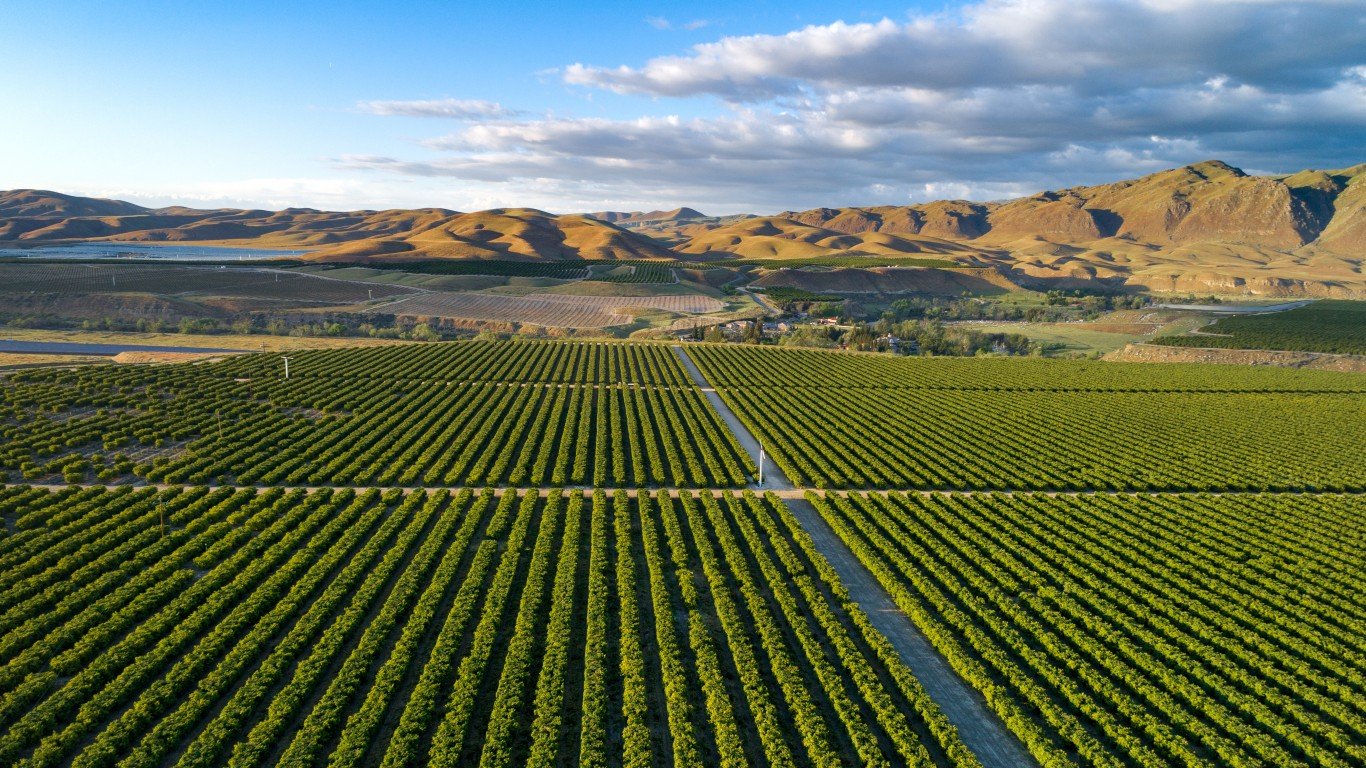
13. Olive Oil
> GHG emissions in kg of CO2 equivalents per 1 kg of food: 5.4
> GHG emissions in kg of CO2 equivalents per nutritional unit: 5.4 per 1 liter refined/filtered (11th highest)
> Land use in sq meters per 1 kg of food: 26.3 (6th highest)
> Freshwater withdrawal in liters per 1 kg of food: 2,141.8 (7th highest)
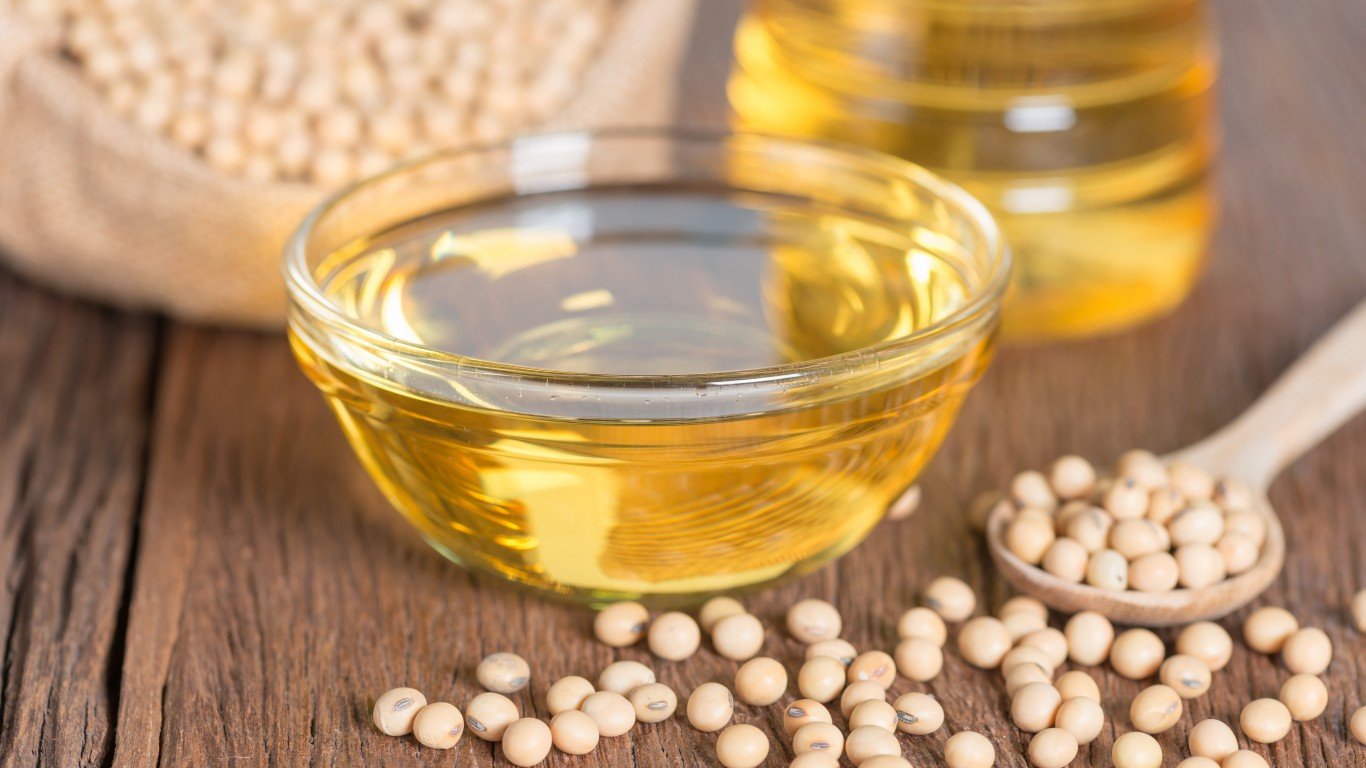
12. Soybean Oil
> GHG emissions in kg of CO2 equivalents per 1 kg of food: 6.3
> GHG emissions in kg of CO2 equivalents per nutritional unit: 6.3 per 1 liter refined/filtered (8th highest)
> Land use in sq meters per 1 kg of food: 10.5 (14th highest)
> Freshwater withdrawal in liters per 1 kg of food: 414.6 (22nd lowest)
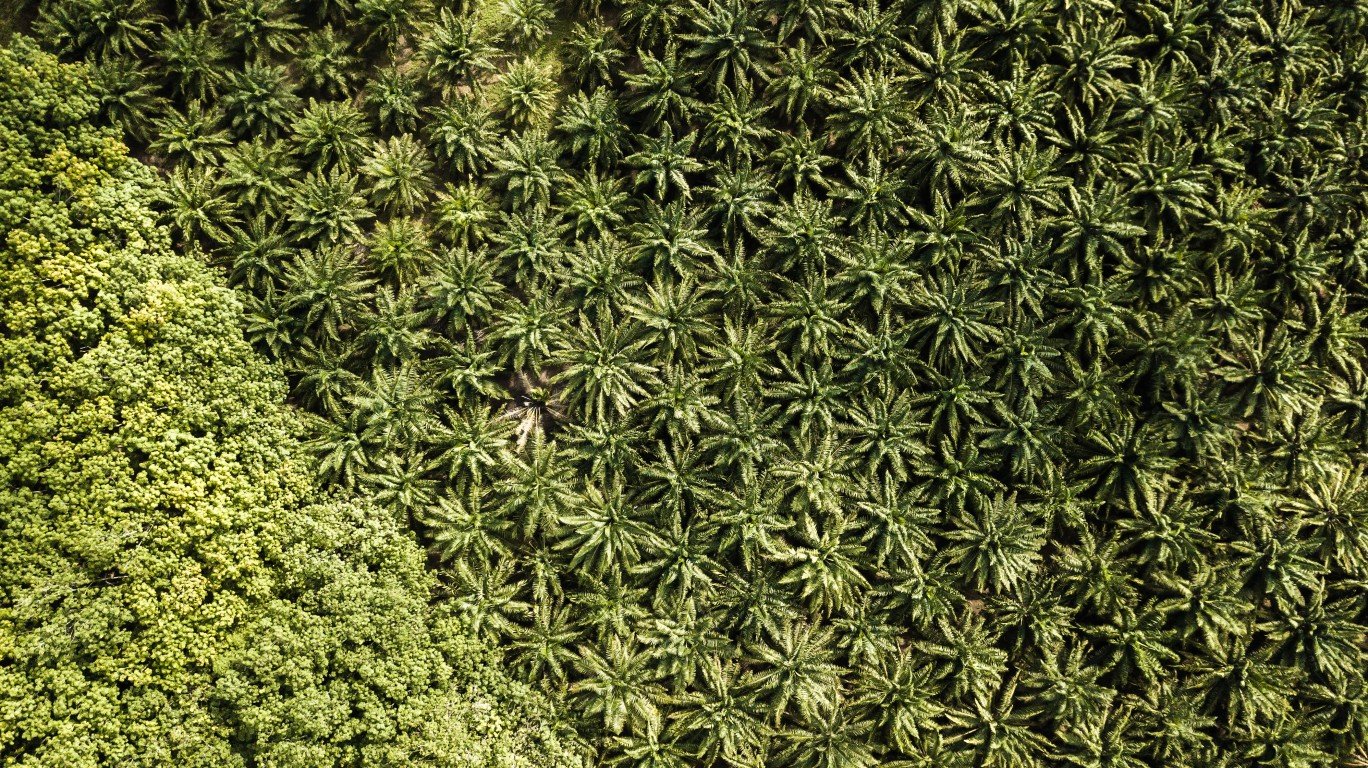
11. Palm Oil
> GHG emissions in kg of CO2 equivalents per 1 kg of food: 7.3
> GHG emissions in kg of CO2 equivalents per nutritional unit: 7.3 per 1 liter refined/filtered (7th highest)
> Land use in sq meters per 1 kg of food: 2.4 (12th lowest)
> Freshwater withdrawal in liters per 1 kg of food: 6.4 (2nd lowest)


