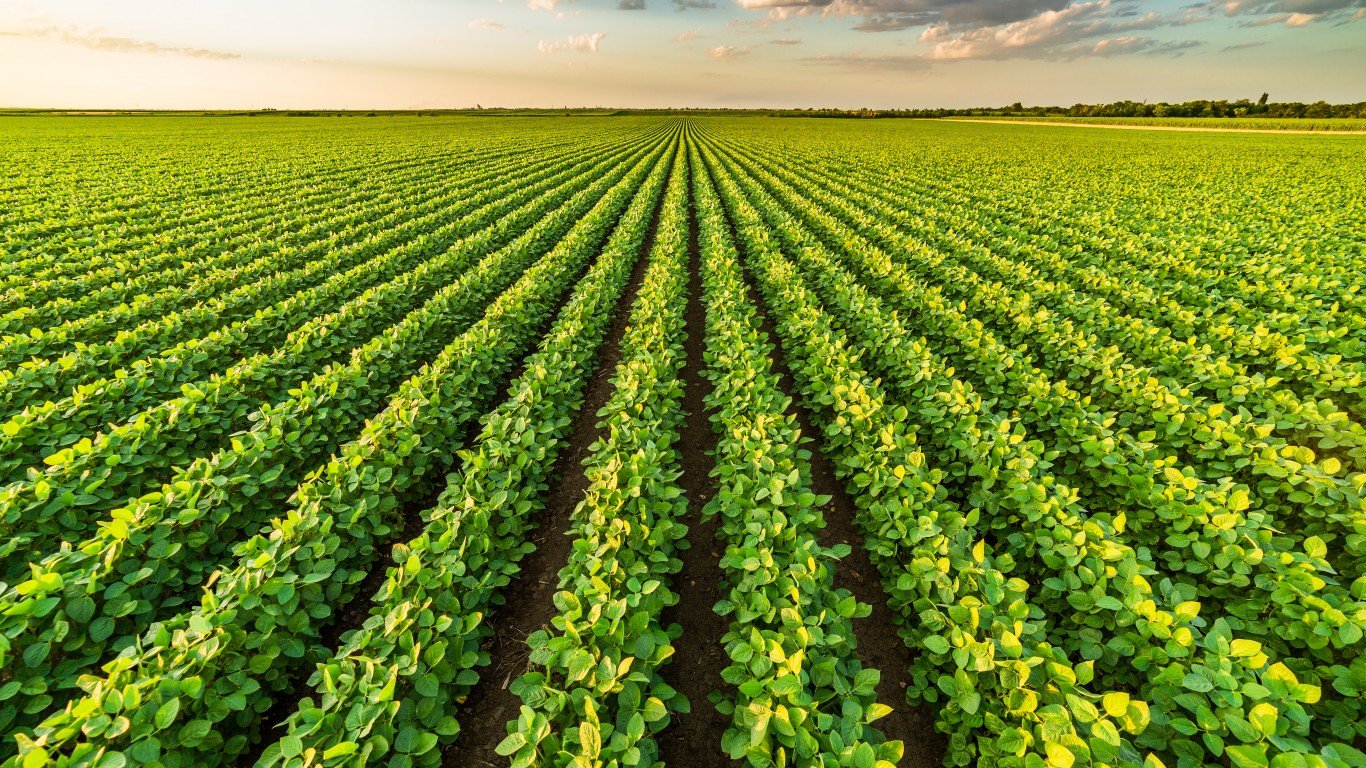
20. Tofu
> GHG emissions in kg of CO2 equivalents per 1 kg of food: 3.2
> GHG emissions in kg of CO2 equivalents per nutritional unit: 2.0 per 100 g protein (19th highest)
> Land use in sq meters per 1 kg of food: 3.5 (16th lowest)
> Freshwater withdrawal in liters per 1 kg of food: 148.6 (14th lowest)

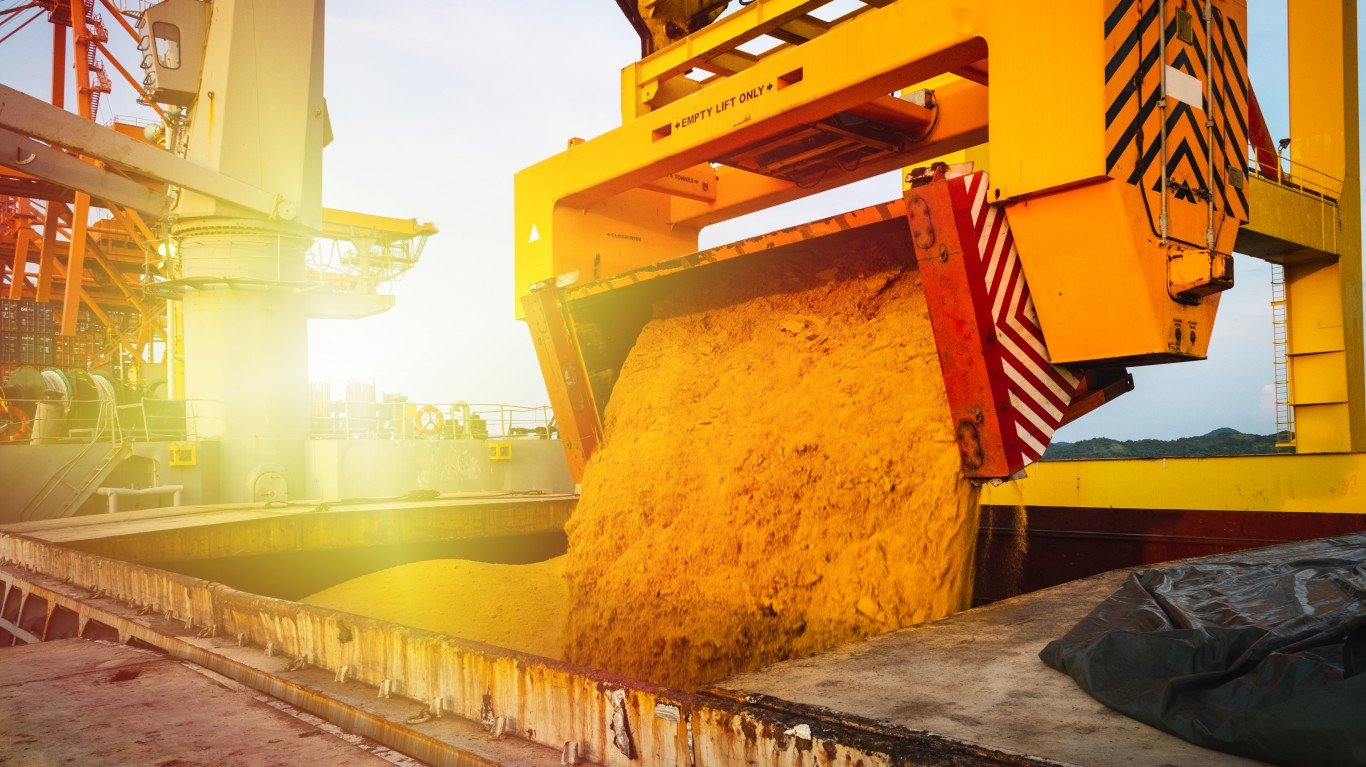
19. Cane Sugar
> GHG emissions in kg of CO2 equivalents per 1 kg of food: 3.2
> GHG emissions in kg of CO2 equivalents per nutritional unit: 3.2 per 1 kg (15th highest)
> Land use in sq meters per 1 kg of food: 2.0 (15th lowest)
> Freshwater withdrawal in liters per 1 kg of food: 620.1 (16th highest)
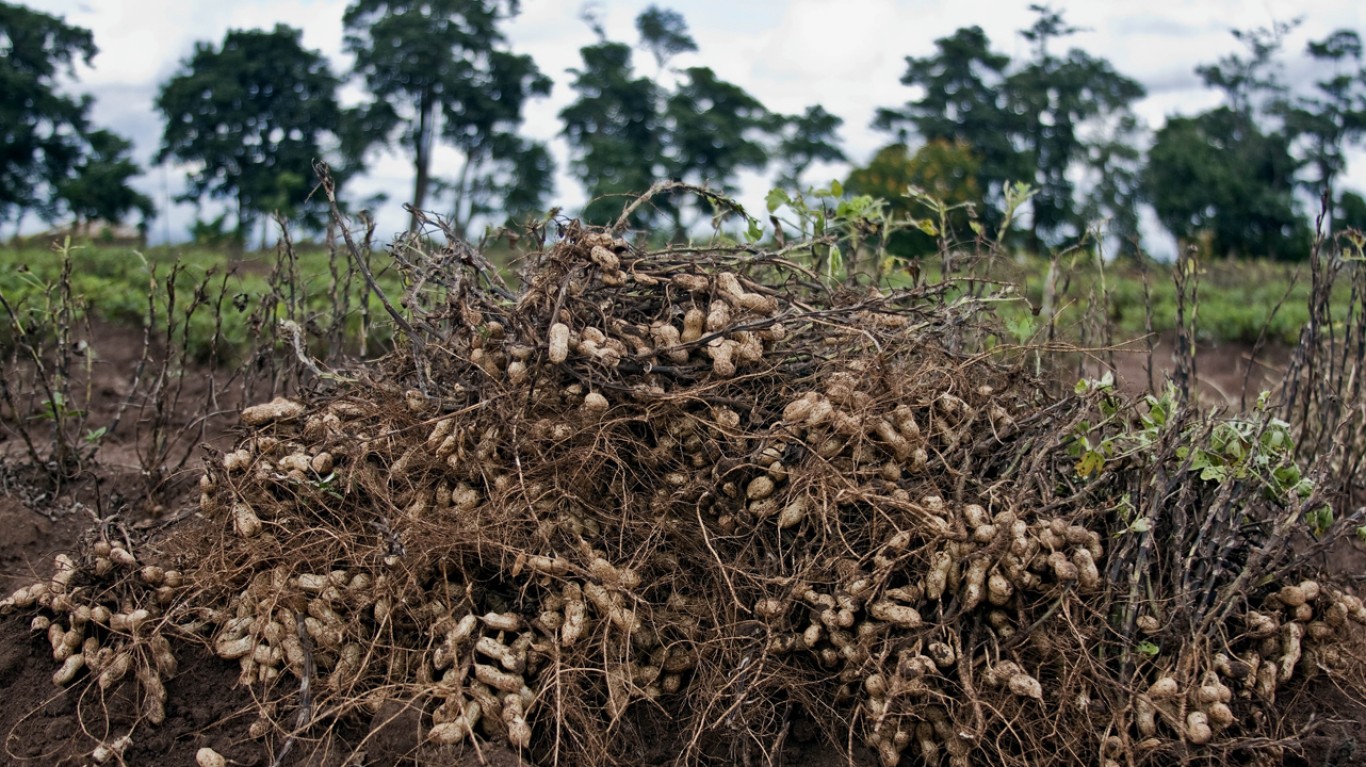
18. Groundnuts
> GHG emissions in kg of CO2 equivalents per 1 kg of food: 3.2
> GHG emissions in kg of CO2 equivalents per nutritional unit: 1.2 per 100 g protein (21st lowest)
> Land use in sq meters per 1 kg of food: 9.1 (15th highest)
> Freshwater withdrawal in liters per 1 kg of food: 1,852.3 (8th highest)
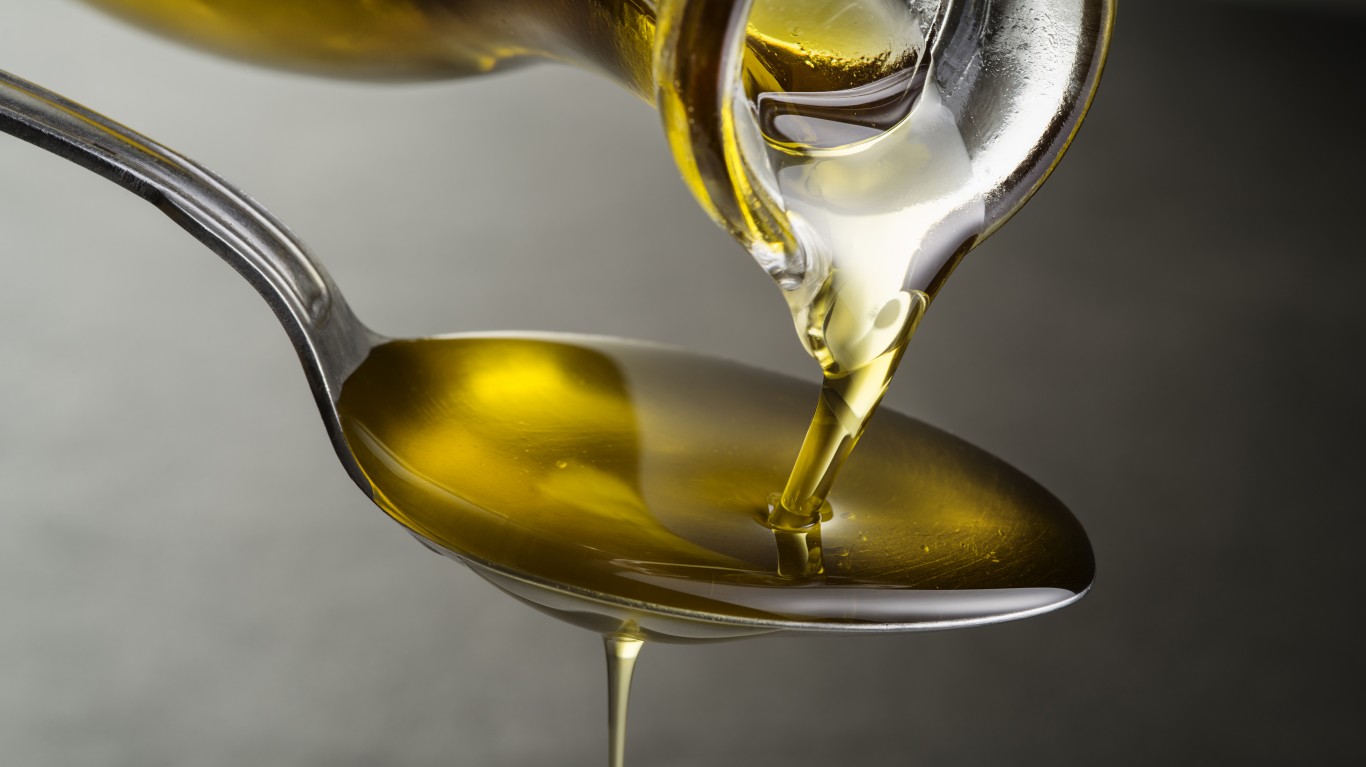
17. Sunflower Oil
> GHG emissions in kg of CO2 equivalents per 1 kg of food: 3.6
> GHG emissions in kg of CO2 equivalents per nutritional unit: 3.6 per 1 liter refined/filtered (14th highest)
> Land use in sq meters per 1 kg of food: 17.7 (8th highest)
> Freshwater withdrawal in liters per 1 kg of food: 1,007.9 (12th highest)
16. Rapeseed Oil
> GHG emissions in kg of CO2 equivalents per 1 kg of food: 3.8
> GHG emissions in kg of CO2 equivalents per nutritional unit: 3.8 per 1 liter refined/filtered (13th highest)
> Land use in sq meters per 1 kg of food: 10.6 (13th highest)
> Freshwater withdrawal in liters per 1 kg of food: 237.7 (19th lowest)


